
この記事では,複数の技術指標を組み合わせた取引戦略システムについて説明します.このシステムは,MACD,EMA,SMP,MA100などの複数の技術分析方法を統合し,リスク管理と時間フィルターと組み合わせて,トレーダーに総合的な取引ソリューションを提供することを目的としています.
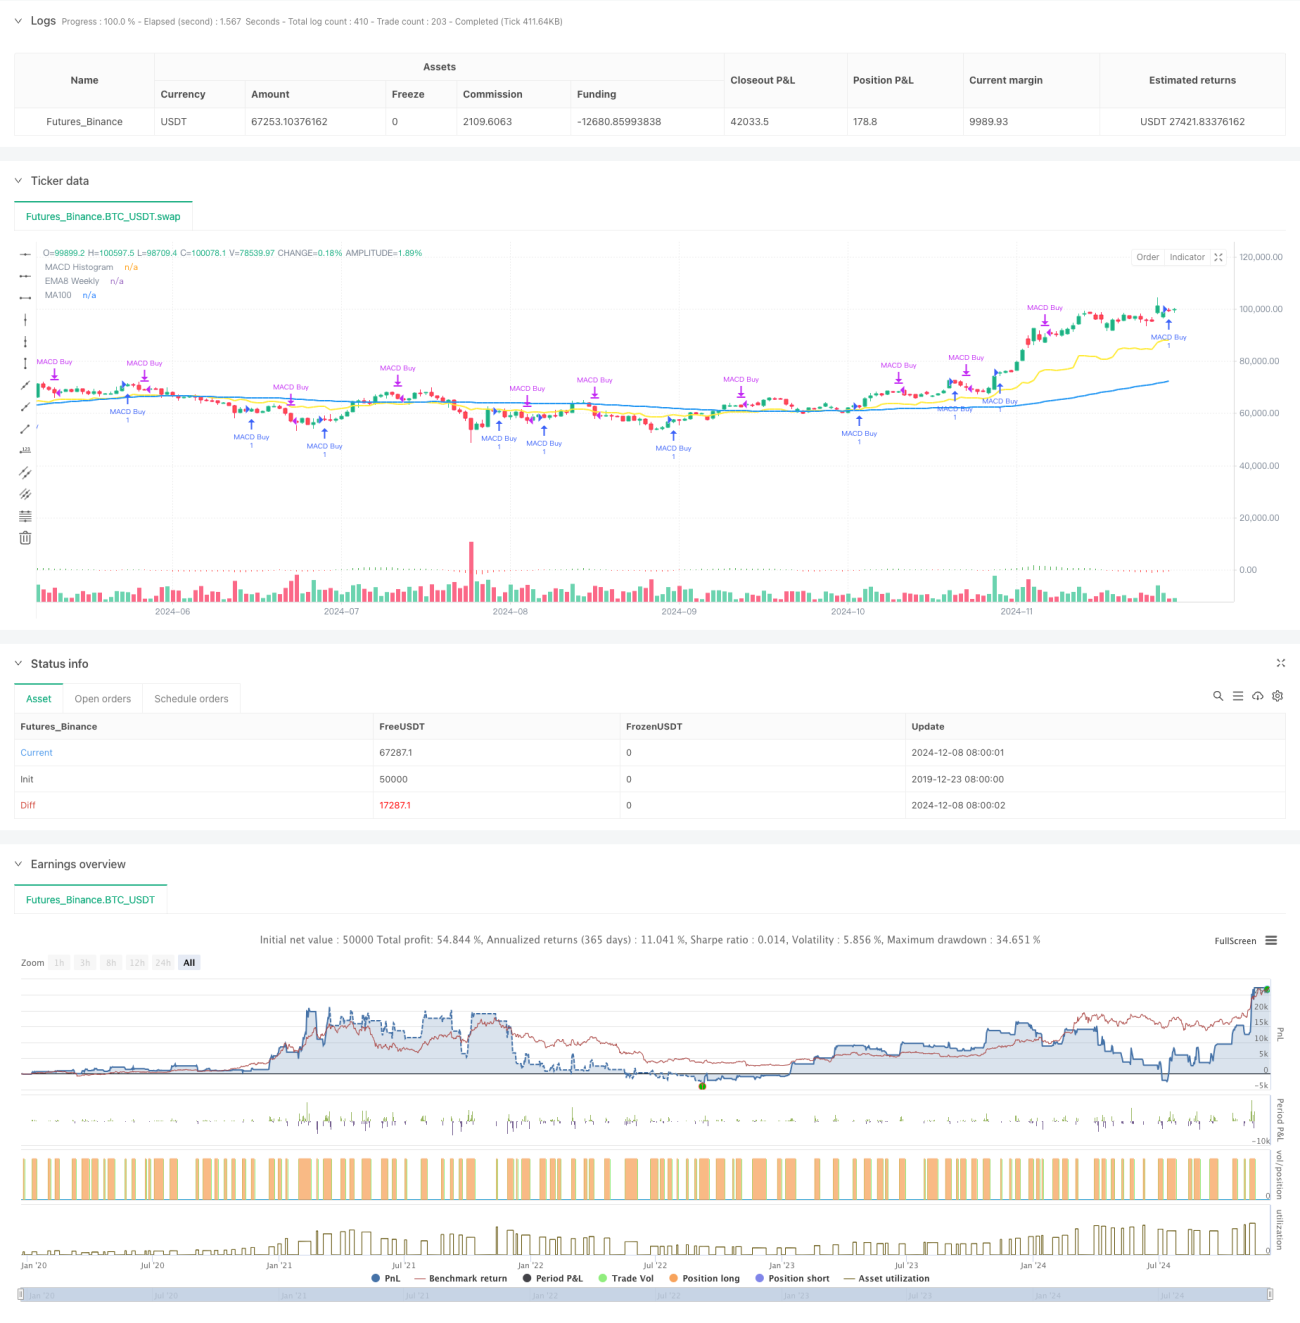
この戦略は,複数の戦略のポートフォリオ型の技術分析システムで,MACD戦略,EMA8戦略,シンプルMA戦略,MA100戦略の4つの独立したサブ戦略で構成されています. このシステムは,市場状況に応じてトレーダーが異なる戦略のタイプを選択する柔軟性を可能にします.各サブ戦略は,独自の入力と出力のロジックを持ち,それに対応するリスク管理メカニズムを備えています.
MACD戦略: MACD直線図の連続した上昇と下降のパターンを識別して市場動向を捉える. 3つの連続した上昇直線図柱が現れたときに買入シグナルを誘発し, 2つの連続した下降直線図柱が販売シグナルを誘発する.
EMA8戦略:周回EMA8平均線,前期高点,K線形状分析を組み合わせる.価格が周回EMA8を突破し,閉盘価格が前期高点より高く,同時に強いK線が現れたとき,システムは買いをする.この戦略は2%のストップ・損失設定を備えている.
シンプルMA戦略:複数の指数移動平均 ((10,15,25,35,40周期) を使ってトレンド追跡システムを構築する.より短い周期平均線がより長い周期平均線の上にあり,価格が最も短い周期平均線を突破したときに買入シグナルをトリガーする.同様に2%のストップを設定する.
MA100戦略:100日平均線,8日平均線と25日平均線を組み合わせ,ランダムな指標を導入して超売り判断する.短期平均線が長期平均線の上にあり,価格がMA100の近くで波動するときは,システムは超売り区域で買い取りの機会を探します.この戦略は3%のストップ・ロスの設定を採用する.
この多戦略の複合型技術分析取引システムは,複数の成熟した技術分析方法の統合によって,トレーダーに包括的な取引意思決定の枠組みを提供します.システムの主な優点は,その柔軟性とリスク管理能力にありますが,同時に,トレーダーが市場についてより深い理解を持っていることが正しく使用される必要があります.継続的な最適化と改善により,このシステムは,より完全な取引ツールになる可能性があります.
/*backtest
start: 2019-12-23 08:00:00
end: 2024-12-09 08:00:00
period: 1d
basePeriod: 1d
exchanges: [{"eid":"Futures_Binance","currency":"BTC_USDT"}]
*/
// This Pine Script™ v5 code implements multiple trading strategies
//@version=5
strategy("Multi-Strategy Trading System", overlay=true)
// Input parameters for customization
strategy_type = input.string("MACD", "Strategy Type", options=["MACD", "EMA8", "SimpleMA", "MA100"])
show_macd = input.bool(true, "Show MACD Signals")
show_ema = input.bool(true, "Show EMA Signals")
show_ma = input.bool(true, "Show MA Signals")
// MACD Strategy Components
[macdLine, signalLine, histLine] = ta.macd(close, 12, 26, 9)
// Function to detect three consecutive ascending histogram bars
isThreeAscendingBars(hist) =>
not na(hist[3]) and hist[3] < hist[2] and hist[2] < hist[1] and hist[1] < hist[0]
// Function to detect two consecutive descending histogram bars
isTwoDescendingBars(hist) =>
not na(hist[2]) and hist[2] > hist[1] and hist[1] > hist[0]
// EMA Strategy Components
ema8_weekly = request.security(syminfo.tickerid, "W", ta.ema(close, 8))
weeklyHigh = request.security(syminfo.tickerid, "W", high)
previousWeekHigh = weeklyHigh[1]
isStrongCandleWeekly = request.security(syminfo.tickerid, "W", close > open and (close - open) > (high - low) * 0.6)
// Simple MA Strategy Components
ema10 = ta.ema(close, 10)
ema15 = ta.ema(close, 15)
ema25 = ta.ema(close, 25)
ema35 = ta.ema(close, 35)
ema40 = ta.ema(close, 40)
// MA100 Strategy Components
ma100 = ta.sma(close, 100)
ma8 = ta.sma(close, 8)
ma25 = ta.sma(close, 25)
// Corrected Stochastic Oscillator Calculation
stochK = ta.stoch(high, low, close, 14)
stochD = ta.sma(stochK, 3)
isOversold = stochK < 20 and stochD < 20
// MACD Strategy Logic
if strategy_type == "MACD"
// Buy condition: Three ascending histogram bars after lowest
if isThreeAscendingBars(histLine)
strategy.entry("MACD Buy", strategy.long)
// Sell condition: Two descending histogram bars after highest
if isTwoDescendingBars(histLine)
strategy.close("MACD Buy")
// EMA8 Strategy Logic
if strategy_type == "EMA8"
if close > ema8_weekly and close > previousWeekHigh and isStrongCandleWeekly
strategy.entry("EMA8 Buy", strategy.long)
strategy.exit("EMA8 Exit", "EMA8 Buy", stop=low - (low * 0.02))
// Simple MA Strategy Logic
if strategy_type == "SimpleMA"
isUptrend = ema10 > ema15 and ema15 > ema25 and ema25 > ema35 and ema35 > ema40
if isUptrend and close > ema10 and close[1] <= ema10[1]
strategy.entry("MA Buy", strategy.long)
strategy.exit("MA Exit", "MA Buy", stop=low - (low * 0.02))
// MA100 Strategy Logic
if strategy_type == "MA100"
isUptrend = ma8 > ma100 and ma25 > ma100
isPriceNearMA100 = math.abs(close - ma100) / ma100 * 100 < 1
if isUptrend and isPriceNearMA100 and isOversold
strategy.entry("MA100 Buy", strategy.long)
strategy.exit("MA100 Exit", "MA100 Buy", stop=low - (low * 0.03))
// Plotting components for visualization
plot(ma100, "MA100", color=color.blue, linewidth=2)
plot(ema8_weekly, "EMA8 Weekly", color=color.yellow, linewidth=2)
plot(series=histLine, title="MACD Histogram", style=plot.style_histogram, color=histLine > 0 ? color.green : color.red)