RSI-ATR モメンタム ボラティリティ コンビネーション トレーディング戦略

1
Follow
1781
Followers
概要
これは,RSI動量指標とATR波動指標を組み合わせた取引戦略システムである.この戦略は,RSIとその移動平均との交差を監視して潜在的な取引機会を識別し,同時にATR指標を波動率フィルターとして使用して,市場が十分な波動性を確保する.この戦略は,欧州取引時間 ((プラハ時間8:00-21:00) で動作し,5分間の周期を採用し,固定的ストップ・ロストレベルを設定している.
戦略原則
戦略の中核となるロジックは、次の主要な要素に基づいています。
- RSI指標は,超買超売り領域を識別するために使用されます.RSIが45を下回ると超売り領域とみなされ,55以上になると超買領域とみなされます.
- RSIと移動平均の交差は,入場シグナルのトリガー条件として
- ATR指標は,低波動環境をフィルタリングするために使用され,ATRが設定された<unk>値よりも高い場合にのみ取引が許可されます.
- 取引時間はプラハ時間8時から21時まで制限されています.
- 固定ストップ・ストップ・ストップ・ストラトジーを採用し,デフォルトは5000ポイントです.
取引の具体的ルールは以下の通りです.
- 多条件:RSIが45以下で移動平均と上方交差し,取引時間および波動率条件を満たす
- 空白条件:RSIが55以上で移動平均と下向きに交差し,取引時間および波動率条件を満たす
- 出場条件: ストップポジットまたはストップローズポイントに触れて自動平仓
戦略的優位性
- 複数のフィルタリング機構:動量指標 ((RSI) と波動率指標 ((ATR) を組み合わせて,偽信号を効果的に減少させる
- タイムフィルタリング:取引時間ウィンドウを制限することで,低流動性の時期に干渉を避ける
- リスク管理の改善: 固定ストップ・ロスを設定し,資金管理を容易にします.
- 参数調整:RSI長さ,ATR<unk>値などの重要なパラメータは,異なる市場状況に応じて最適化できます.
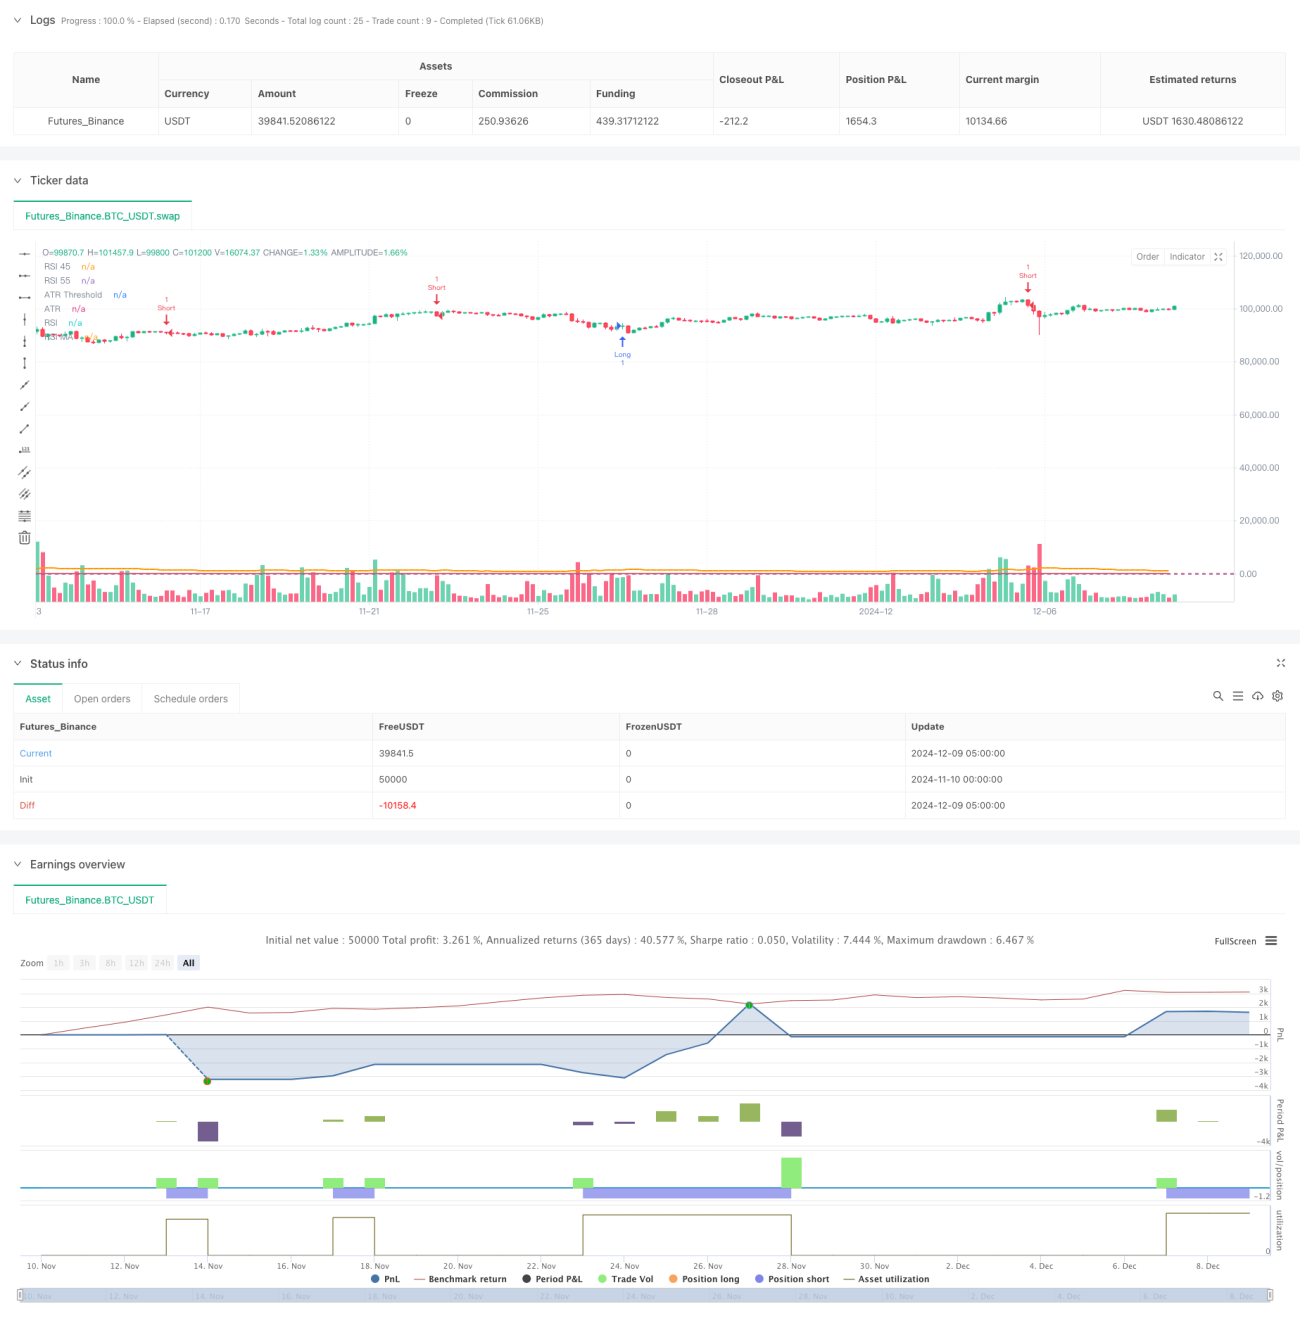
- 予想結果は堅調で,スライドポイントと手数料を考慮すると,勝率は64.4%で,損益比は1.1%だった.
戦略リスク
- 固定ストップ・ロスは,すべての市場環境に適していない可能性があり,急激な変動期間に早期出場を引き起こす可能性があります.
- RSI指標はトレンド市場において頻繁に偽信号を生成する可能性があります.
- ATRのフィルタリングにより,戦略が重要な市場機会を逃す可能性があります.
- タイムウィンドウの制限により,他の時間帯での高品質の取引機会が逃れることがあります.
- 戦略はパラメータによる最適化に依存し,過度に最適化すると過適合のリスクが発生する
戦略最適化の方向性
- ダイナミックストップ損失:市場変動に適応するために,ATRのダイナミックに合わせてストップ損失の幅を調整することを考慮することができます.
- トレンドフィルター: 変動市場における偽信号を減らすために,移動平均システムなどのトレンド判断指標を追加する
- 入場時刻変更:入場品質を向上させるための補助確認として,入場量指標の追加を検討できる
- タイムウィンドウの最適化: 異なる市場の特性を考慮して,より多くの機会を捉えるために取引のタイムウィンドウを調整する
- 資金管理モジュール追加: 動的な保有規模管理を実現し,リスクをより良く管理する
要約する
この戦略は,RSIとATRの指標を組み合わせて,比較的完全な取引システムを構築している.戦略の主要な優位性は,複数のフィルタリング機構と完善なリスク管理にあるが,同時にいくつかの限界がある.提案された最適化の方向によって,戦略は,より良いパフォーマンスを得る見通しがある.鍵は,実際の取引環境に応じてパラメータを継続的に調整し,最適化し,戦略の適応性を維持することである.
Source
Pine
Strategy parameters
Related strategies
Comment
All comments (0)
No data
- 1