ボリンジャーバンドとRSI指標に基づくダイナミックな取引戦略

1
Follow
1781
Followers
概要
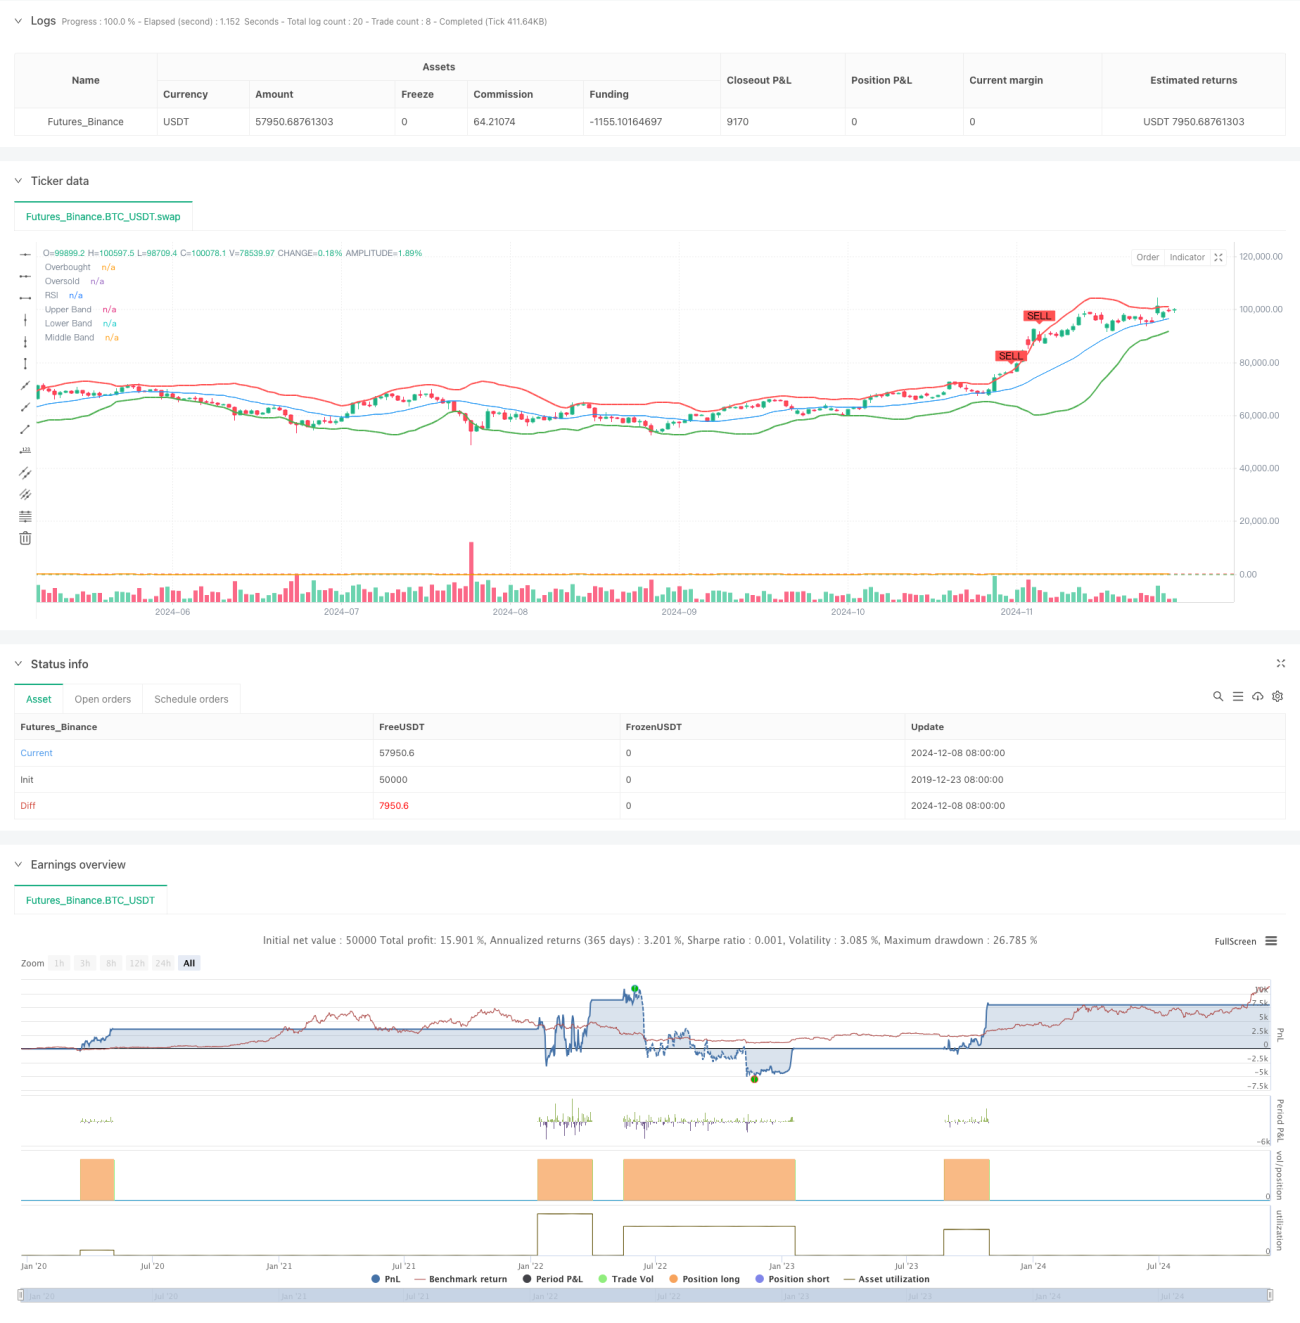
この戦略は,ブリン帯 ((Bollinger Bands) と相対的に強い指数 ((RSI)) を組み合わせた自適化取引システムである.この戦略は,ブリン帯の価格チャネルとRSIの超買い超売り信号によって潜在的な取引機会を識別し,市場傾向と変動の把握を実現する.この戦略は,標準差を動的に調整する取引区間を採用し,RSI指標の超買い超売りレベルと組み合わせて取引信号を確認し,取引の正確性を向上させる.
戦略原則
戦略の核心は,ブリン帯の上,中,下軌道とRSIの組み合わせで市場の波動の機会を捉えることです.ブリン帯は20周期の移動平均に基づいており,標準差の2倍を使用して下線を計算しています.RSIは14サイクル計算を採用し,70を超買い,30を超売りレベルに設定しています.価格が下線を触れたときに,RSIは超売り領域にあり,システムは買入シグナルを生成します.価格が軌道に触れたときに,RSIは超売り領域にあり,システムは売りシグナルを生成します.この二重確認機構は,偽の信号を効果的に減らすことができます.
戦略的優位性
- 適応性:ブリン帯は,市場の変動に応じて取引区間を自動的に調整し,異なる市場環境に適応します.
- 信号の信頼性: ブリン帯とRSIの二重確認メカニズムにより,偽信号が著しく減少する.
- リスク管理:ブリン帯の標準差計算は,ダイナミックなリスク管理機構を提供する.
- 視覚効果: 戦略は,トレーダーが理解し,実行するために,明確な視覚信号を提供します.
- パラメータの柔軟性:主要パラメータは,異なる市場の特徴に応じて調整することができます.
戦略リスク
- 横盤の振動市場では,頻繁に偽のブレイクシグナルが生じることがあります.
- 遅滞のリスク: 移動平均とRSIは遅滞のリスクを伴う.
- パラメータの感受性: パラメータの異なる設定により,戦略のパフォーマンスに大きな違いが生じることがあります.
- 市場環境依存性: 傾向が顕著な市場ではよりよいパフォーマンスを発揮し,震動市場では効果が悪くなることがあります.
戦略最適化の方向性
- トレンドフィルター: 長期移動平均やトレンド指標を追加して取引方向をフィルターする.
- 動的パラメータ調整:市場の変動に応じてブリン帯とRSIパラメータを自動的に調整する.
- 取引量確認: 取引量分析を信号システムに追加する.
- 最適化ストップ設定:ATRストップまたはパーセンテージ移動ストップのようなダイナミックストップメカニズムを導入する.
- 加入時間フィルター:市場の時間特性を考慮し,不適切な時間帯での取引を避ける.
要約する
この戦略はブリン帯とRSIの組み合わせを用いて,比較的完全な取引システムを構築している.戦略の優点は,市場の波動に適応し,信頼できる取引信号を提供できることです.しかし,戦略のパフォーマンスに及ぼす市場環境の影響を考慮する必要があります.提案された最適化の方向によって,戦略の安定性と信頼性がさらに向上する見込みがあります.実際の適用では,特定の市場の特徴に応じて取引者の調整を推奨し,他の技術分析ツールと組み合わせて取引決定を行う.
Source
Pine
Strategy parameters
Related strategies
Comment
All comments (0)
No data
- 1