
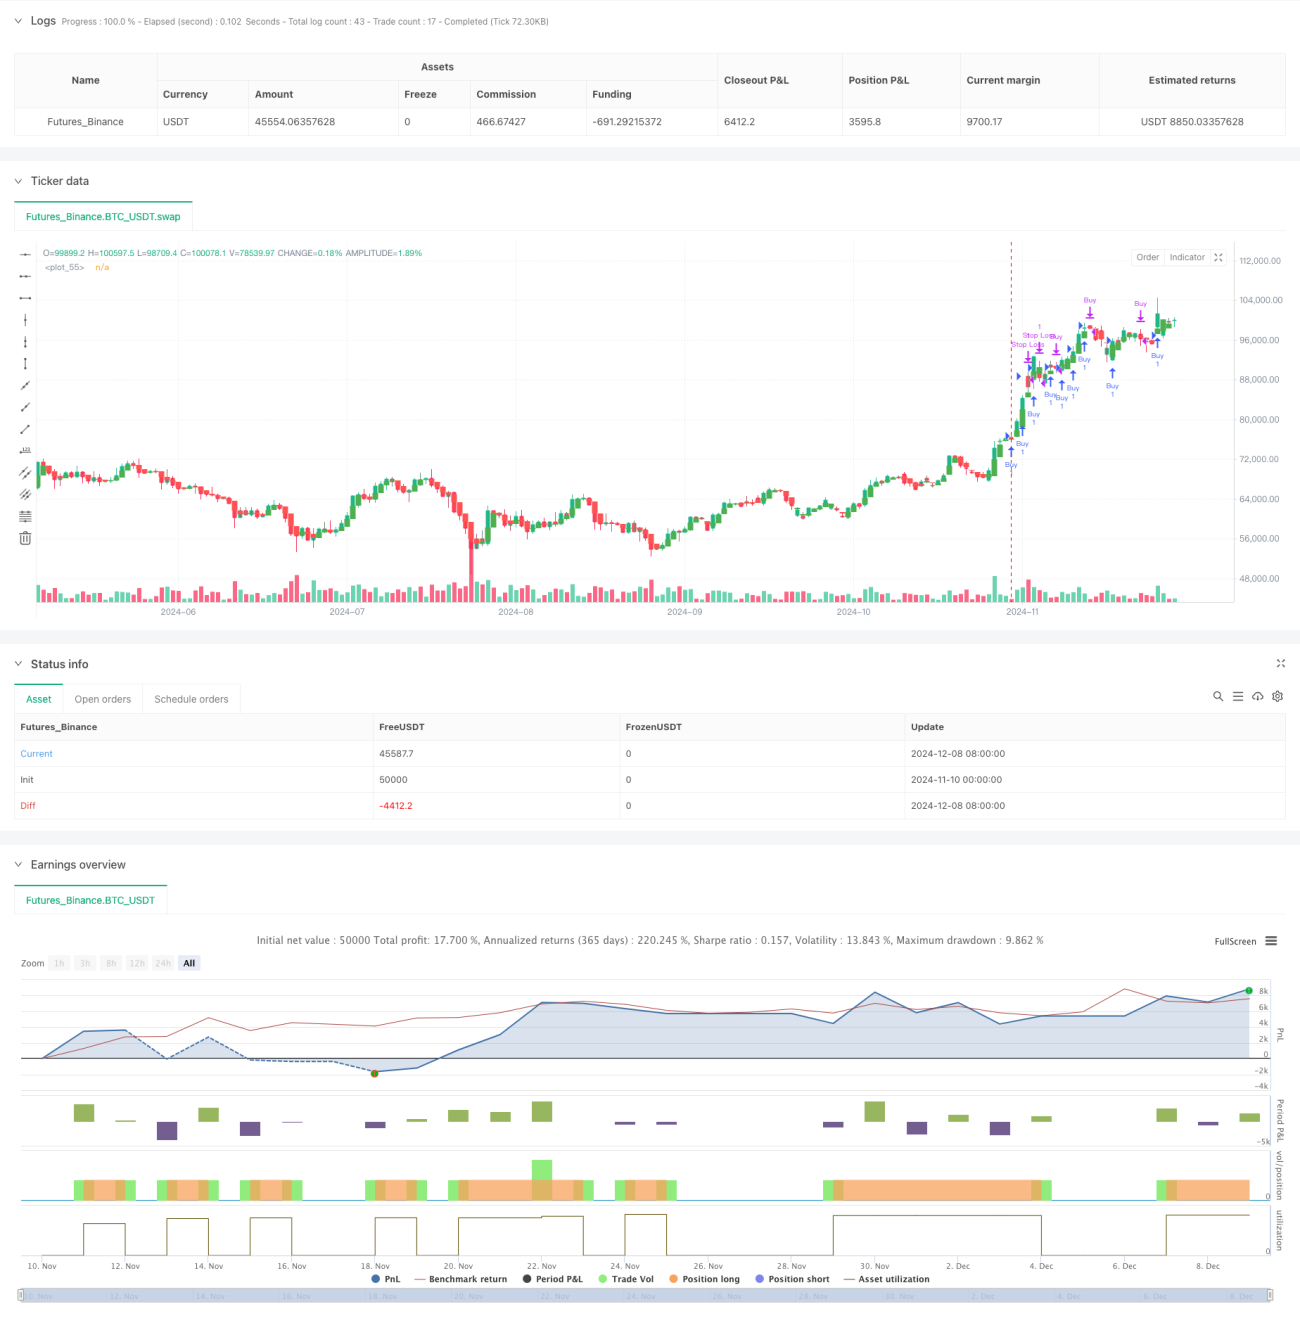
この戦略は,平らなハイキン・アシ・グラフに基づくトレンド追跡システムである.ハイキン・アシ・グラフを高時間周期で計算し,それを低時間周期の取引決定に適用することで,市場騒音の影響を効果的に軽減する.この戦略は,多,空,または双方向の取引を可能にする柔軟な取引方向の選択を提供し,止損停止機能を統合し,完全な自動化された取引プロセスを実現する.
戦略の核心的な論理は,ハイキン・アシグラフの高時間周期での平滑性の特性を利用してトレンドを識別することです.ハイキン・アシグラフは,開値と閉値の移動平均を計算することによって,市場騒音を効果的にフィルターし,主要なトレンドを突出します.緑のが現れたときに上昇傾向を表す場合は,システムは多モードでポジションを開きます.赤のが現れたときに下降傾向を表す場合は,システムは空調でポジションを開きます.戦略には,リスク制御と利益のロックを助けるために,パーセントベースのストップ・アンド・ストップメカニズムも含まれています.
この戦略は,多周期的なヘイキン・アシ指数の滑らかな特性により,市場動向を効果的に捉え,完善したリスク管理機構によって逆転を制御する.戦略の柔軟性と拡張性により,優れた実用価値があり,継続的な最適化と改善により,異なる市場環境に対応できる.一定のリスクがあるものの,合理的なパラメータ設定とリスク管理により,安定した取引パフォーマンスを達成できる.
/*backtest
start: 2024-11-10 00:00:00
end: 2024-12-09 08:00:00
period: 1d
basePeriod: 1d
exchanges: [{"eid":"Futures_Binance","currency":"BTC_USDT"}]
*/
//@version=5
strategy("Optimized Heikin Ashi Strategy with Buy/Sell Options", overlay=true)
// User inputs for customizing backtest settings
startDate = input(timestamp("2023-01-01 00:00"), title="Backtest Start Date", tooltip="Start date for the backtest")
endDate = input(timestamp("2024-01-01 00:00"), title="Backtest End Date", tooltip="End date for the backtest")
// Input for Heikin Ashi timeframe optimization
ha_timeframe = input.timeframe("D", title="Heikin Ashi Timeframe", tooltip="Choose the timeframe for Heikin Ashi candles")
// Inputs for optimizing stop loss and take profit
use_stop_loss = input.bool(true, title="Use Stop Loss")
stop_loss_percent = input.float(2.0, title="Stop Loss (%)", minval=0.0, tooltip="Set stop loss percentage")
use_take_profit = input.bool(true, title="Use Take Profit")
take_profit_percent = input.float(4.0, title="Take Profit (%)", minval=0.0, tooltip="Set take profit percentage")
// Input to choose Buy or Sell
trade_type = input.string("Buy Only", options=["Buy Only", "Sell Only"], title="Trade Type", tooltip="Choose whether to only Buy or only Sell")
// Heikin Ashi calculation on a user-defined timeframe
ha_open = request.security(syminfo.tickerid, ha_timeframe, ta.sma(open, 2), barmerge.gaps_off, barmerge.lookahead_on)
ha_close = request.security(syminfo.tickerid, ha_timeframe, ta.sma(close, 2), barmerge.gaps_off, barmerge.lookahead_on)
ha_high = request.security(syminfo.tickerid, ha_timeframe, math.max(high, close), barmerge.gaps_off, barmerge.lookahead_on)
ha_low = request.security(syminfo.tickerid, ha_timeframe, math.min(low, open), barmerge.gaps_off, barmerge.lookahead_on)
// Heikin Ashi candle colors
ha_bullish = ha_close > ha_open // Green candle
ha_bearish = ha_close < ha_open // Red candle
// Backtest period filter
inDateRange = true
// Trading logic depending on user input
if (inDateRange) // Ensures trades happen only in the selected period
if (trade_type == "Buy Only") // Buy when green, Sell when red
if (ha_bullish and strategy.position_size <= 0) // Buy on green candle only if no position is open
strategy.entry("Buy", strategy.long)
if (ha_bearish and strategy.position_size > 0) // Sell on red candle (close the long position)
strategy.close("Buy")
if (trade_type == "Sell Only") // Sell when red, Exit sell when green
if (ha_bearish and strategy.position_size >= 0) // Sell on red candle only if no position is open
strategy.entry("Sell", strategy.short)
if (ha_bullish and strategy.position_size < 0) // Exit the sell position on green candle
strategy.close("Sell")
// Add Stop Loss and Take Profit conditions if enabled
if (use_stop_loss)
strategy.exit("Stop Loss", from_entry="Buy", stop=strategy.position_avg_price * (1 - stop_loss_percent / 100))
if (use_take_profit)
strategy.exit("Take Profit", from_entry="Buy", limit=strategy.position_avg_price * (1 + take_profit_percent / 100))
// Plot Heikin Ashi candles on the chart
plotcandle(ha_open, ha_high, ha_low, ha_close, color=ha_bullish ? color.green : color.red)