
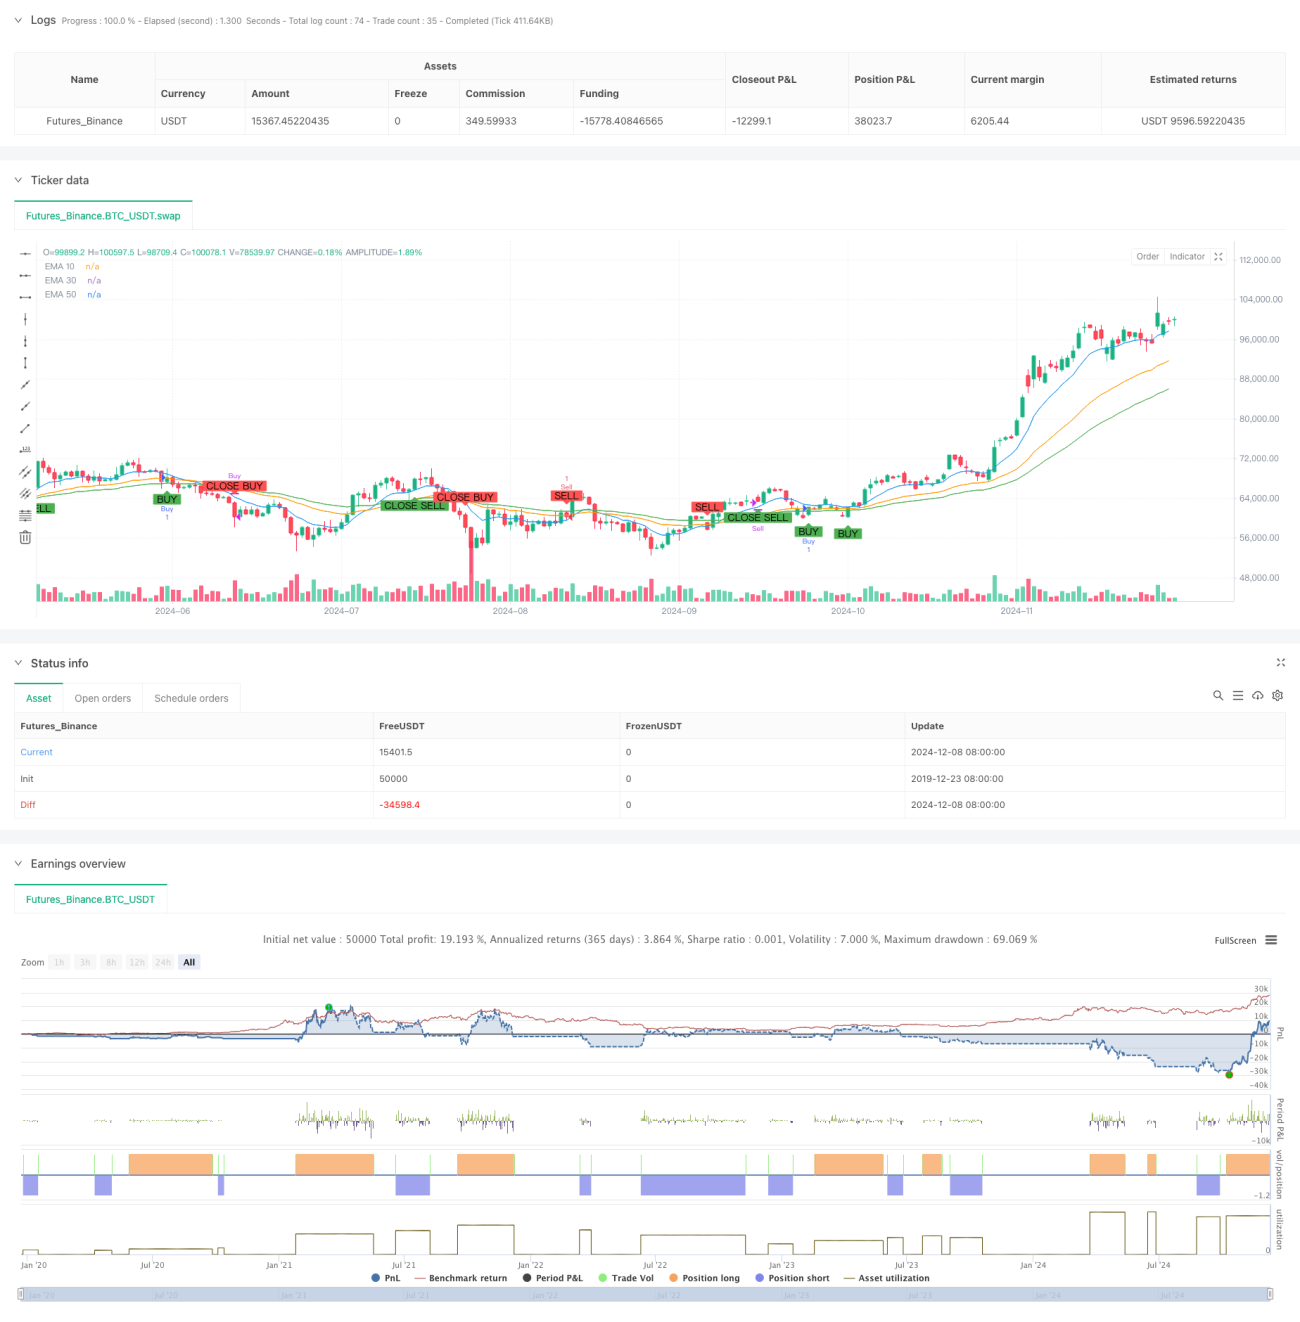
この戦略は,複数の指数移動平均 (EMA) をベースにしたトレンド追跡取引システムである.価格の横断とトレンド方向の判断を組み合わせた3つの異なる周期の10・30・50のEMAラインを使用して,完全な買入シグナルシステムを構築する.戦略の設計は,トレンドの形成,確認,転換を十分に考慮し,市場における主要なトレンドの機会を効果的に捉える.
この戦略は,取引のシグナルを特定するために階層的な判断の仕組みを採用しています.
これは合理的で論理的に明確なトレンド追跡戦略である.多重平均線の配合による使用は,戦略の安定性を保証するとともに,明確な取引信号を提供します.ある程度の遅れのリスクがあるものの,合理的な最適化とリスク管理措置によって,戦略全体は優れた実用価値を示しています.安定した収益とリスクを制御するトレーダーの使用に特に適しています.
/*backtest
start: 2019-12-23 08:00:00
end: 2024-12-09 08:00:00
period: 1d
basePeriod: 1d
exchanges: [{"eid":"Futures_Binance","currency":"BTC_USDT"}]
*/
// This Pine Script™ code is subject to the terms of the Mozilla Public License 2.0 at https://mozilla.org/MPL/2.0/
// © banyat6913
//@version=5
strategy("EMA Trend Strategy", overlay=true)
// Input Parameters
ema_short_length = input.int(10, title="EMA Short Length", minval=1)
ema_mid_length = input.int(30, title="EMA Mid Length", minval=1)
ema_long_length = input.int(50, title="EMA Long Length", minval=1)
// Calculate EMA
ema_short = ta.ema(close, ema_short_length)
ema_mid = ta.ema(close, ema_mid_length)
ema_long = ta.ema(close, ema_long_length)
// **TREND UP**
// 1. EMA 10 > EMA 30 > EMA 50
uptrend_condition = ema_short > ema_mid and ema_mid > ema_long
// 2. Bullish Candle Crossing Up EMA 30
bullish_candle = close > open
cross_up_ema_mid = ta.crossover(close, ema_mid)
// 3. If EMA 30 crosses down EMA 50 -> Close Buy Order
ema_30_cross_down_50 = ta.crossunder(ema_mid, ema_long)
// Buy Signal
buy_signal = uptrend_condition and cross_up_ema_mid
// Sell Signal for closing Buy Order
close_buy_signal = ema_30_cross_down_50
// **TREND DOWN**
// 1. EMA 50 > EMA 30 > EMA 10
downtrend_condition = ema_long > ema_mid and ema_mid > ema_short
// 2. Bearish Candle Crossing Down EMA 30
bearish_candle = close < open
cross_down_ema_mid = ta.crossunder(close, ema_mid)
// 3. If EMA 30 crosses up EMA 50 -> Close Sell Order
ema_30_cross_up_50 = ta.crossover(ema_mid, ema_long)
// Sell Signal
sell_signal = downtrend_condition and cross_down_ema_mid
// Buy Signal for closing Sell Order
close_sell_signal = ema_30_cross_up_50
// Backtesting Logic
if (buy_signal)
strategy.entry("Buy", strategy.long)
if (close_buy_signal)
strategy.close("Buy")
if (sell_signal)
strategy.entry("Sell", strategy.short)
if (close_sell_signal)
strategy.close("Sell")
// Plot EMA Lines
plot(ema_short, color=color.blue, title="EMA 10")
plot(ema_mid, color=color.orange, title="EMA 30")
plot(ema_long, color=color.green, title="EMA 50")
// Plot Buy and Sell Signals on Chart
plotshape(buy_signal, style=shape.labelup, location=location.belowbar, color=color.new(color.green, 0), text="BUY", title="Buy Signal")
plotshape(close_buy_signal, style=shape.labeldown, location=location.abovebar, color=color.new(color.red, 0), text="CLOSE BUY", title="Close Buy Signal")
plotshape(sell_signal, style=shape.labeldown, location=location.abovebar, color=color.new(color.red, 0), text="SELL", title="Sell Signal")
plotshape(close_sell_signal, style=shape.labelup, location=location.belowbar, color=color.new(color.green, 0), text="CLOSE SELL", title="Close Sell Signal")