MACDと線形回帰デュアルシグナルインテリジェントトレーディング戦略

MACD LRS WMA TEMA EMA SMA
作成日: 2024-12-11 15:46:20 最終変更日: 2024-12-11 15:46:20
コピー: 0 クリック数: 361
1
フォロー
1617
フォロワー

MACDと線形回帰デュアルシグナルインテリジェントトレーディング戦略

概要

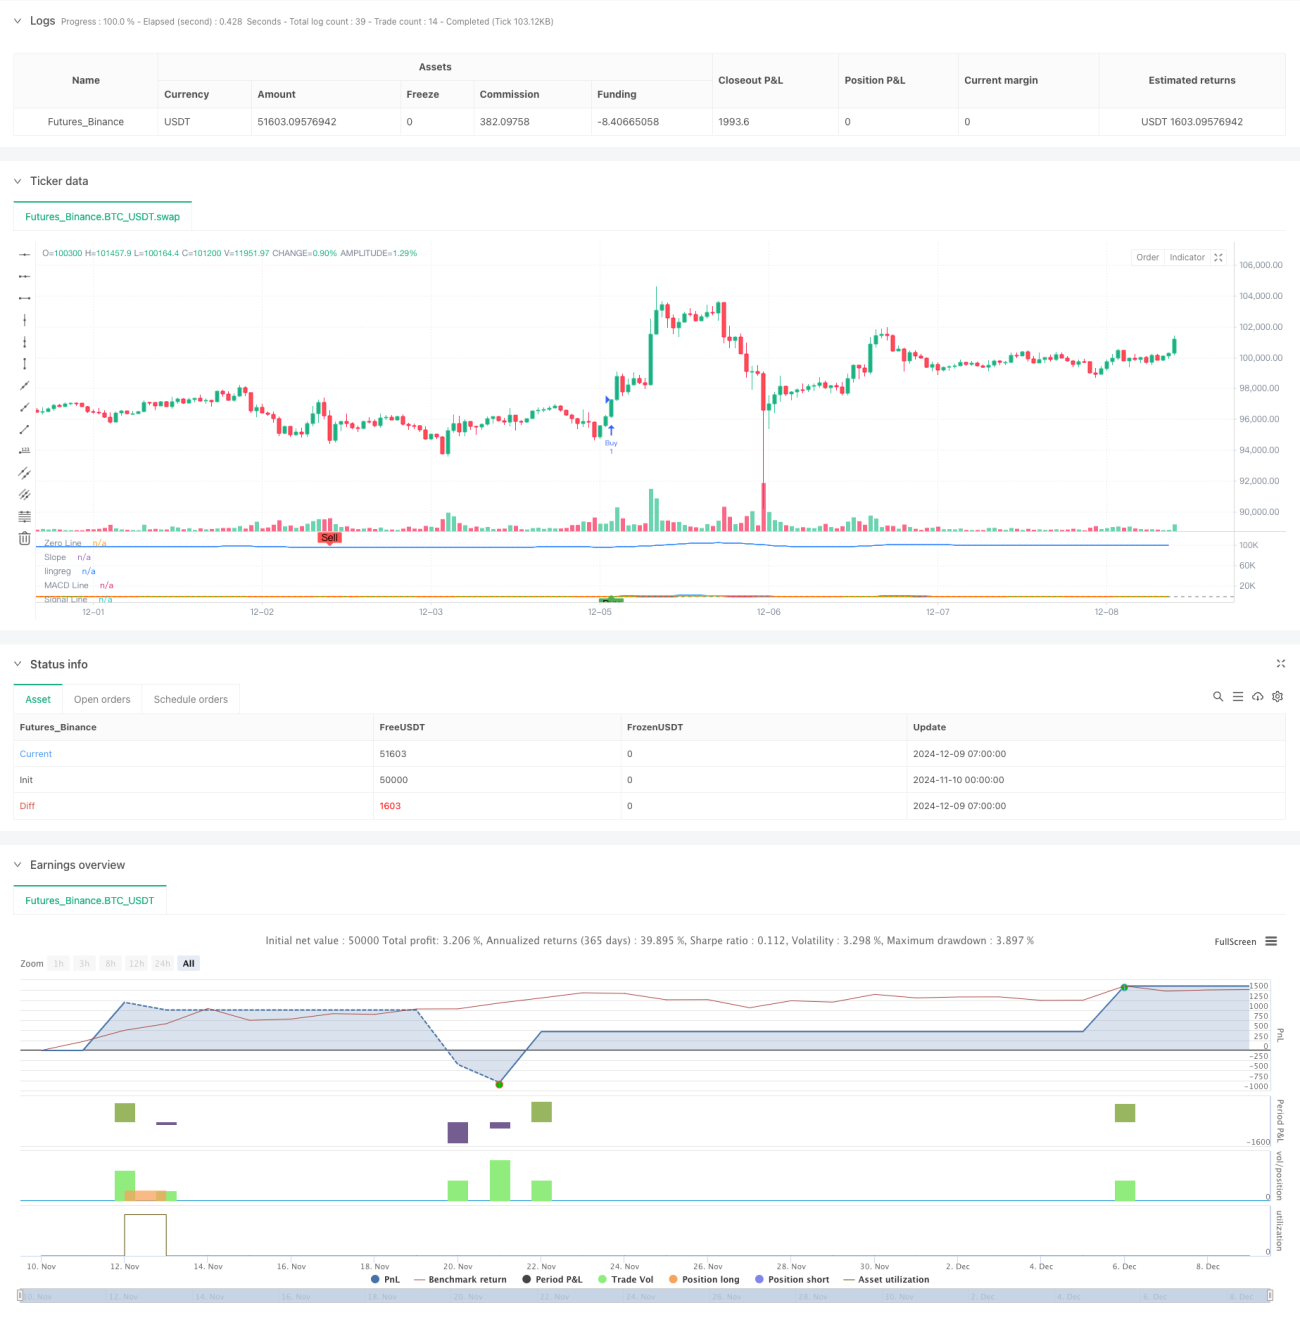
この戦略は,MACD ((移動平均線収束散布指数) と線形回帰斜率 ((LRS) を組み合わせたスマート取引システムである.この戦略は,複数の移動平均方法の組み合わせによってMACD指数の計算を最適化し,取引シグナルの信頼性を高めるために線形回帰分析を導入している.この戦略は,トレーダーに,取引シグナルを生成するために単一指数または二重指数の組み合わせを使用する柔軟な選択を許可し,リスク制御のためのストップダメージメカニズムを装備している.

戦略原則

戦略の核心は,最適化されたMACDと線形リターン指標によって市場トレンドを捉えることである.MACD部分は,SMA,EMA,WMA,TEMAの4つの移動平均の組み合わせを用いて計算され,価格トレンドに対する感受性を高めている.線形リターン部分は,リターンラインの斜率と位置を計算してトレンドの方向と強さを判断する.購入信号は,MACDの金叉線形リターンの上昇傾向,またはその両者の組み合わせに基づいて確認することができる.同様に,売り信号は柔軟に配置することができる.戦略には,パーセントのストップベースのストップ損失設定が含まれ,取引毎のリスク/リターン比率を効果的に管理する.

戦略的優位性

  1. 指数组合の柔軟性:市場の状況に応じて単一指数または二重指数组合を使用する選択
  2. 改良されたMACD計算:複数の移動平均法により,トレンド識別の精度が向上
  3. 客観的なトレンド確認: 線形回帰を用いて数学的統計的支持のトレンド判断
  4. リスク管理の改善: 統合されたストップダストメカニズム
  5. パラメータの柔軟性: 市場特性に合わせて,重要なパラメータを最適化できます.

戦略リスク

  1. パラメータの感受性:異なる市場環境により,パラメータを頻繁に調整する必要がある
  2. 信号の遅延:移動平均類の指標に一定の遅延がある
  3. 横盤の振動は偽信号を発生させる可能性がある.
  4. 双重認証による機会コスト: 厳格な双重認証により,良い取引機会が逃される可能性があります.

戦略最適化の方向性

  1. 市場環境の認識を高めること:トレンドと揺動の市場を区別するための波動性指標の導入
  2. ダイナミックパラメータ調整:市場の状況に応じてMACDと線形回帰を自動的に調整するパラメータ
  3. ストップ・ストップ・損失を最適化: 市場変動に応じて自動的に調整するダイナミックなストップ・ストップ・損失を導入
  4. 取引量分析を増やす:取引量指標を組み合わせて信号の信頼性を高める
  5. タイムサイクル分析の導入:取引の正確性を高めるために複数のタイムサイクル確認を考慮する

要約する

この戦略は,クラシック指標の改良版と統計学的手法を組み合わせて,柔軟性と信頼性の両方を兼ね備えた取引システムを創造している.そのモジュール化された設計は,トレーダーが異なる市場環境に応じて戦略パラメータとシグナル確認機構を柔軟に調整することを可能にする.継続的な最適化と改善により,この戦略は,さまざまな市場環境で安定したパフォーマンスを維持すると見込まれている.

ストラテジーソースコード
/*backtest
start: 2024-11-10 00:00:00
end: 2024-12-09 08:00:00
period: 1h
basePeriod: 1h
exchanges: [{"eid":"Futures_Binance","currency":"BTC_USDT"}]
*/

//@version=6
strategy('SIMPLIFIED MACD & LRS Backtest by NHBProd', overlay=false)

// Function to calculate TEMA (Triple Exponential Moving Average)
tema(src, length) =>
    ema1 = ta.ema(src, length)
    ema2 = ta.ema(ema1, length)
    ema3 = ta.ema(ema2, length)
    3 * (ema1 - ema2) + ema3

// MACD Calculation Function
macdfx(src, fast_length, slow_length, signal_length, method) =>
    fast_ma = method == 'SMA' ? ta.sma(src, fast_length) :
              method == 'EMA' ? ta.ema(src, fast_length) :
              method == 'WMA' ? ta.wma(src, fast_length) :
              tema(src, fast_length)
    slow_ma = method == 'SMA' ? ta.sma(src, slow_length) :
              method == 'EMA' ? ta.ema(src, slow_length) :
              method == 'WMA' ? ta.wma(src, slow_length) :
              tema(src, slow_length)
    macd = fast_ma - slow_ma
    signal = method == 'SMA' ? ta.sma(macd, signal_length) :
             method == 'EMA' ? ta.ema(macd, signal_length) :
             method == 'WMA' ? ta.wma(macd, signal_length) :
             tema(macd, signal_length)
    hist = macd - signal
    [macd, signal, hist]

// MACD Inputs
useMACD = input(true, title="Use MACD for Signals")
src = input(close, title="MACD Source")
fastp = input(12, title="MACD Fast Length")
slowp = input(26, title="MACD Slow Length")
signalp = input(9, title="MACD Signal Length")
macdMethod = input.string('EMA', title='MACD Method', options=['EMA', 'SMA', 'WMA', 'TEMA'])

// MACD Calculation
[macd, signal, hist] = macdfx(src, fastp, slowp, signalp, macdMethod)

// Linear Regression Inputs
useLR = input(true, title="Use Linear Regression for Signals")
lrLength = input(24, title="Linear Regression Length")
lrSource = input(close, title="Linear Regression Source") 
lrSignalSelector = input.string('Rising Linear', title='Signal Selector', options=['Price Above Linear', 'Rising Linear', 'Both'])

// Linear Regression Calculation
linReg = ta.linreg(lrSource, lrLength, 0)
linRegPrev = ta.linreg(lrSource, lrLength, 1)
slope = linReg - linRegPrev

// Linear Regression Buy Signal
lrBuySignal = lrSignalSelector == 'Price Above Linear' ? (close > linReg) :
              lrSignalSelector == 'Rising Linear' ? (slope > 0 and slope > slope[1]) :
              lrSignalSelector == 'Both' ? (close > linReg and slope > 0) : false

// MACD Crossover Signals
macdCrossover = ta.crossover(macd, signal)

// Buy Signals based on user choices
macdSignal = useMACD and macdCrossover
lrSignal = useLR and lrBuySignal

// Buy condition: Use AND condition if both are selected, OR condition if only one is selected
buySignal = (useMACD and useLR) ? (macdSignal and lrSignal) : (macdSignal or lrSignal)

// Plot MACD
hline(0, title="Zero Line", color=color.gray)
plot(macd, color=color.blue, title="MACD Line", linewidth=2)
plot(signal, color=color.orange, title="Signal Line", linewidth=2)
plot(hist, color=hist >= 0 ? color.green : color.red, style=plot.style_columns, title="MACD Histogram")

// Plot Linear Regression Line and Slope
plot(slope, color=slope > 0 ? color.purple : color.red, title="Slope", linewidth=2)
plot(linReg,title="lingreg")
// Signal Plot for Visualization
plotshape(buySignal, style=shape.labelup, location=location.bottom, color=color.new(color.green, 0), title="Buy Signal", text="Buy")

// Sell Signals for Exiting Long Positions
macdCrossunder = ta.crossunder(macd, signal)  // MACD Crossunder for Sell Signal
lrSellSignal = lrSignalSelector == 'Price Above Linear' ? (close < linReg) :
               lrSignalSelector == 'Rising Linear' ? (slope < 0 and slope < slope[1]) :
               lrSignalSelector == 'Both' ? (close < linReg and slope < 0) : false

// User Input for Exit Signals: Select indicators to use for exiting trades
useMACDSell = input(true, title="Use MACD for Exit Signals")
useLRSell = input(true, title="Use Linear Regression for Exit Signals")

// Sell condition: Use AND condition if both are selected to trigger a sell at the same time, OR condition if only one is selected
sellSignal = (useMACDSell and useLRSell) ? (macdCrossunder and lrSellSignal) : 
             (useMACDSell ? macdCrossunder : false) or 
             (useLRSell ? lrSellSignal : false)

// Plot Sell Signals for Visualization (for exits, not short trades)
plotshape(sellSignal, style=shape.labeldown, location=location.top, color=color.new(color.red, 0), title="Sell Signal", text="Sell")

// Alerts
alertcondition(buySignal, title="Buy Signal", message="Buy signal detected!")
alertcondition(sellSignal, title="Sell Signal", message="Sell signal detected!")

// Take Profit and Stop Loss Inputs
takeProfit = input.float(10.0, title="Take Profit (%)")  // Take Profit in percentage
stopLoss = input.float(0.10, title="Stop Loss (%)")        // Stop Loss in percentage

// Backtest Date Range
startDate = input(timestamp("2024-01-01 00:00"), title="Start Date")
endDate = input(timestamp("2025-12-12 00:00"), title="End Date")
inBacktestPeriod = true
// Entry Rules (Only Long Entries)
if (buySignal and inBacktestPeriod)
    strategy.entry("Buy", strategy.long)

// Exit Rules (Only for Long Positions)
strategy.exit("Exit Buy", from_entry="Buy", limit=close * (1 + takeProfit / 100), stop=close * (1 - stopLoss / 100))

// Exit Long Position Based on Sell Signals
if (sellSignal and inBacktestPeriod)
    strategy.close("Buy", comment="Exit Signal")