
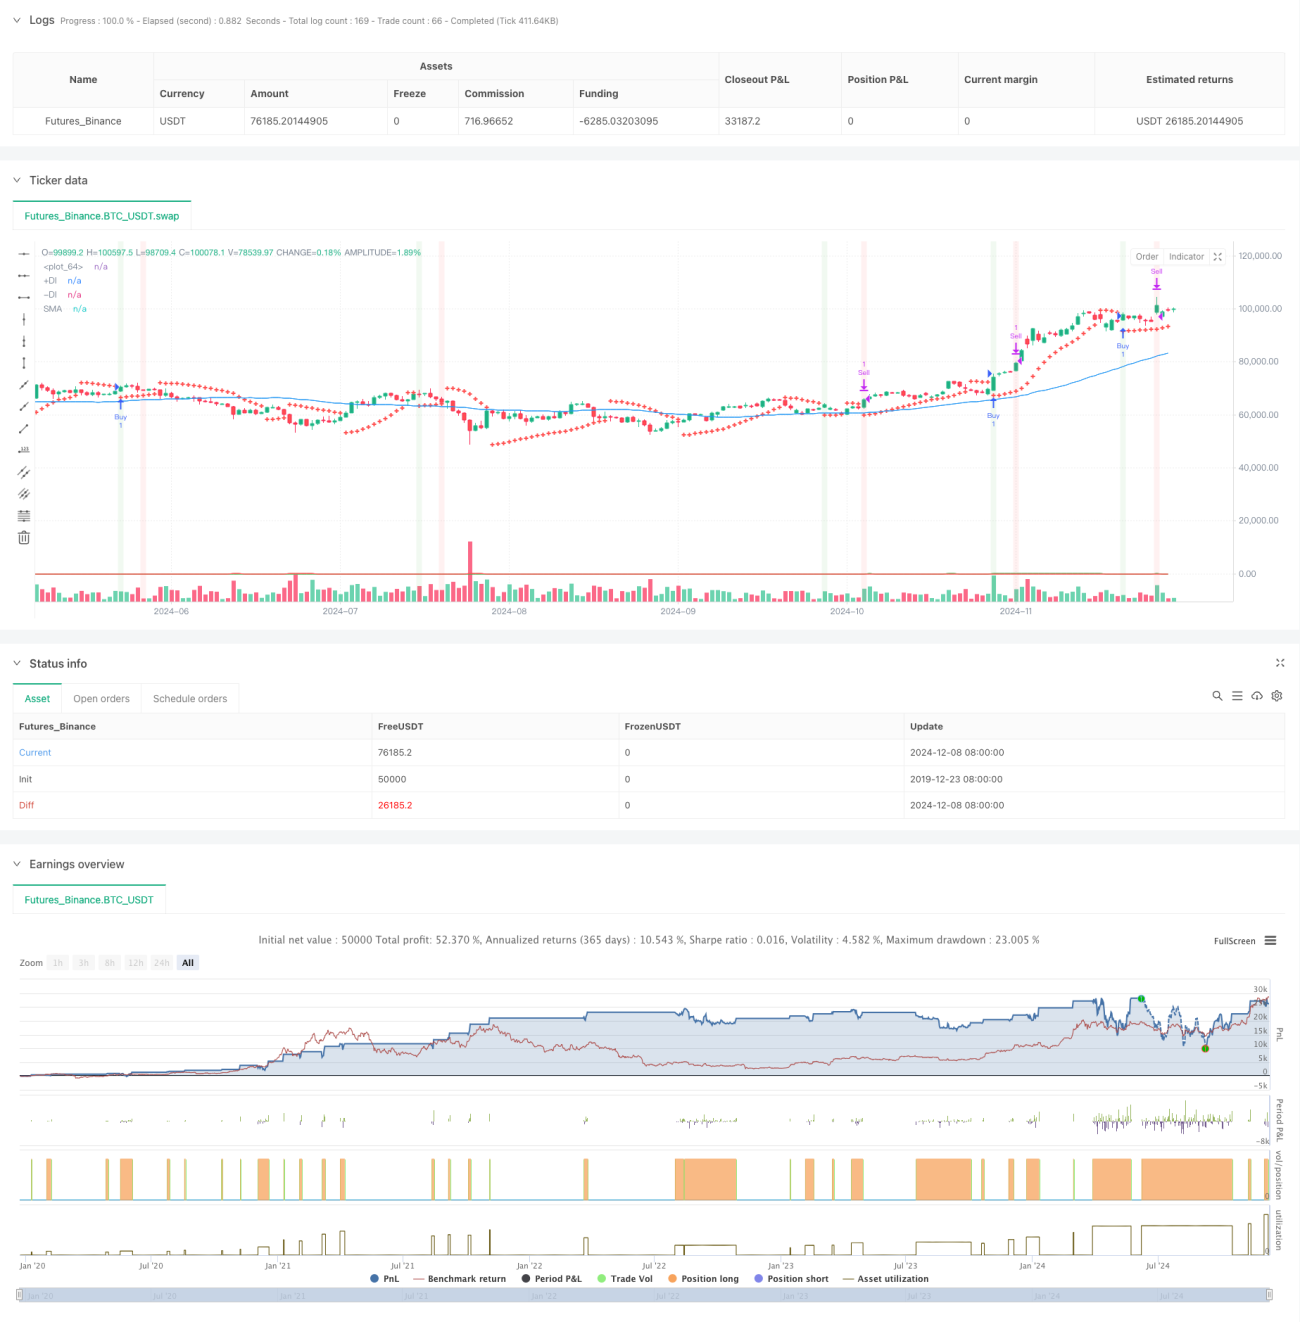
この戦略は,複数の技術指標を組み合わせたトレンド追跡取引システムである.これは,主にパラパラ線転換指標 (SAR),移動平均 (SMA) および方向運動指標 (DMI) を使用して,市場トレンドと入場タイミングを決定し,百分比ストップとMACDの逆行によって出場を最適化します.戦略の設計の中心的な考えは,強いトレンドの後に入場を確認し,既定の利益目標が達成されたり,トレンド転換シグナルが発生したときに出場することです.
この戦略は,取引信号を確認するために,複数のフィルタリングメカニズムを使用しています.
この戦略は,複数の技術指標の協調的な配合によって,比較的完全なトレンド追跡取引システムを構築している.その優点は,信号確認の信頼性とリスク管理の柔軟性にある.ある程度の遅れのリスクがあるものの,パラメータの最適化とダイナミックな管理メカニズムへの参加により,戦略の全体的なパフォーマンスは,依然として優れた応用価値を有している.継続的な最適化と改善により,この戦略は,安定した取引ツールになることができる.
/*backtest
start: 2019-12-23 08:00:00
end: 2024-12-09 08:00:00
period: 1d
basePeriod: 1d
exchanges: [{"eid":"Futures_Binance","currency":"BTC_USDT"}]
*/
//@version=5
strategy("Swing Trading Strategy with DMI", overlay=true)
// Define parameters
sarStart = input.float(0.02, title="SAR Start")
sarIncrement = input.float(0.02, title="SAR Increment")
sarMax = input.float(0.2, title="SAR Max")
atrLength = input.int(10, title="ATR Length")
macdShort = input.int(12, title="MACD Short Length")
macdLong = input.int(26, title="MACD Long Length")
macdSignal = input.int(9, title="MACD Signal Length")
smaLength = input.int(50, title="SMA Length")
dmiLength = input.int(14, title="DMI Length")
adxSmoothing = input.int(14, title="ADX Smoothing") // Smoothing period for ADX
targetProfitPercentage = input.float(3.0, title="Target Profit Percentage")
// Calculate SAR
sar = ta.sar(sarStart, sarIncrement, sarMax)
// Calculate ATR
atr = ta.atr(atrLength)
// Calculate MACD
[macdLine, macdSignalLine, _] = ta.macd(close, macdShort, macdLong, macdSignal)
// Calculate SMA
sma = ta.sma(close, smaLength)
bullishTrend = close > sma
// Calculate DMI
[plusDI, minusDI, adx] = ta.dmi(dmiLength, adxSmoothing) // Specify ADX smoothing period
// Determine if DMI is bullish
dmiBullish = plusDI > minusDI
// Define buy signal
buySignal = ta.crossover(close, sar) and bullishTrend and dmiBullish
// Track buy price and position state
var float buyPrice = na
var bool inPosition = false
// Enter position
if (buySignal and not inPosition)
buyPrice := close
inPosition := true
strategy.entry("Buy", strategy.long)
// Define target price (3% above the buy price)
targetPrice = na(buyPrice) ? na : buyPrice * (1 + targetProfitPercentage / 100)
// Define MACD sell signal
macdSellSignal = ta.crossunder(macdLine, macdSignalLine)
// Define sell signal
sellSignal = inPosition and (close >= targetPrice or macdSellSignal)
// Exit position
if (sellSignal)
inPosition := false
strategy.exit("Sell", "Buy", limit=targetPrice)
// Plot SAR on the chart
plot(sar, color=color.red, style=plot.style_cross, linewidth=2)
// Plot SMA (optional, for visualizing the trend)
plot(sma, color=color.blue, title="SMA")
// Plot DMI +DI and -DI
plot(plusDI, color=color.green, title="+DI")
plot(minusDI, color=color.red, title="-DI")
// Plot buy signal on the chart
//plotshape(series=buySignal, location=location.belowbar, color=color.green, style=shape.labelup, text="BUY")
// Plot sell signal on the chart
//plotshape(series=sellSignal, location=location.abovebar, color=color.red, style=shape.labeldown, text="SELL")
// Optional: Plot background color for buy and sell signals
bgcolor(buySignal ? color.new(color.green, 90) : na, title="Buy Signal Background")
bgcolor(sellSignal ? color.new(color.red, 90) : na, title="Sell Signal Background")