強化されたモメンタムオシレーターとストキャスティクスダイバージェンス定量取引戦略

AC RSI SMA STOCH TP SL AO DIV
作成日: 2024-12-11 17:34:01 最終変更日: 2024-12-11 17:34:01
コピー: 1 クリック数: 361
1
フォロー
1617
フォロワー

強化されたモメンタムオシレーターとストキャスティクスダイバージェンス定量取引戦略

概要

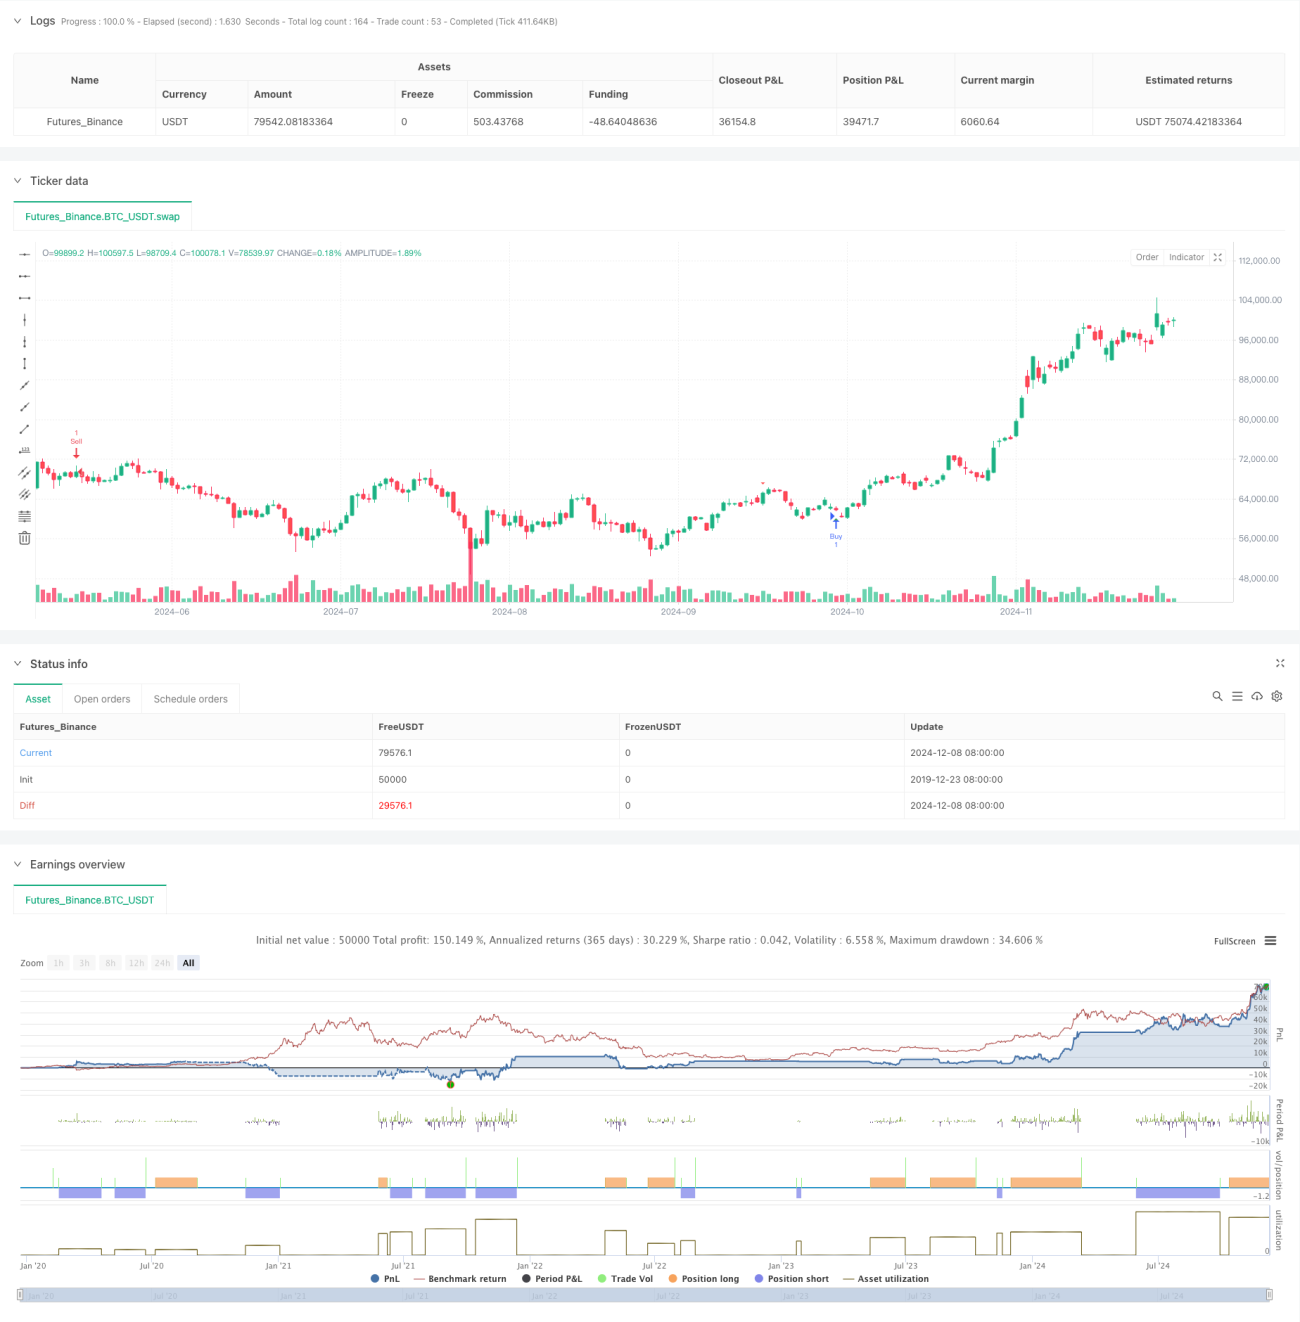
この戦略は,加速振動指数 ((AC) とランダム指数 ((Stochastic) を組み合わせた定量取引システムである.これは,価格と技術指数との間の偏差を認識することによって,市場の動力の転換を捉え,潜在的トレンドの逆転を予測する.この戦略は,均線 ((SMA) と相対的に弱い指数 ((RSI) を統合して,信号の信頼性を高め,リスクを制御するために固定ストップを設定する.

戦略原則

戦略の核心的な論理は,複数の技術指標の協調配合に基づいています. まず,価格の中央値の5周期と34周期平均線の差を計算して,そのN周期平均線を減算して得られる加速振動指標 (((AC) を計算します. 同時に,価格創新が低いとき,AC指標が高くなる時,看板の背中が形成され,価格創新が高くなる時,AC指標が低くなる時,看板の背中が形成されます.

戦略的優位性

  1. マルチ指標協同:AC,ストキャスティック,RSIの3つの指標の組み合わせにより,偽の信号を効果的にフィルタリングできます.
  2. オートメーションのリスク管理: 固定ポイントのストップ・ストップ・損失設定を内蔵し,取引ごとにリスクを効果的に制御します.
  3. ビジュアルヒント:取引先が迅速に機会を認識できるように,取引先の取引シグナルをグラフに明確に表示する
  4. 柔軟性:異なる市場環境と取引サイクルに適応するパラメータの調整性
  5. リアルタイムのアラート: リアルタイムのアラートシステムが組み込まれ,取引機会を逃さないようにします.

戦略リスク

  1. 偽の突破リスク: 揺れ動いている市場では偽の脱却信号が生じる可能性がある
  2. スライドポイントリスク: 固定ポイントのストップを用いることで,市場が激しく波動すると,大きなスライドポイントに直面する可能性があります.
  3. パラメータ感度: 異なるパラメータの組み合わせにより、戦略のパフォーマンスに大きな違いが生じる可能性があります。
  4. 市場環境依存: 傾向がはっきりしない市場では,戦略は効果的でない可能性がある
  5. 信号遅延性:平均線計算を使用しているため,信号に一定の遅延がある可能性があります.

戦略最適化の方向性

  1. ダイナミックストップ・ストラスト:市場の変動率に応じてダイナミックに調整できるストップ・ストラストポイント
  2. 交差量指標の導入:交差量確認によって信号の信頼性を高める
  3. 市場環境フィルター:トレンド判断モジュールを追加し,異なる市場環境で異なる取引戦略を採用する
  4. オプティマイズパラメータ選択: 機械学習による各指標パラメータの組み合わせの最適化
  5. タイムフィルターを増やす:市場の時間特性を考慮し,不利な時期に取引を避ける

要約する

これは,複数の技術指標を融合した量化取引戦略で,信号から離れることで市場の転換点を捕捉する.この戦略の強みは,複数の指標のクロス検証と完善したリスク管理システムにあるが,偽突破やパラメータ最適化などの問題にも注意する必要がある.この戦略は,継続的な最適化と改善によって,異なる市場環境で安定したパフォーマンスを維持する見込みである.

ストラテジーソースコード
/*backtest
start: 2019-12-23 08:00:00
end: 2024-12-09 08:00:00
period: 1d
basePeriod: 1d
exchanges: [{"eid":"Futures_Binance","currency":"BTC_USDT"}]
*/

// This Pine Script™ code is subject to the terms of the Mozilla Public License 2.0 at https://mozilla.org/MPL/2.0/
// © JayQwae


//@version=5
strategy("Enhanced AC Divergence Strategy with Stochastic Divergence", overlay=true)

// Input settings
tp_pips = input.float(0.0020, "Take Profit (in price)", step=0.0001)
sl_pips = input.float(0.0040, "Stop Loss (in price)", step=0.0001)  // 40 pips
ac_length = input.int(5, "AC Length")
rsi_length = input.int(14, "RSI Length")
stoch_k = input.int(14, "Stochastic K Length")
stoch_d = input.int(3, "Stochastic D Smoothing")
stoch_ob = input.float(80, "Stochastic Overbought Level")
stoch_os = input.float(20, "Stochastic Oversold Level")

// Accelerator Oscillator Calculation
high_low_mid = (high + low) / 2
ao = ta.sma(high_low_mid, 5) - ta.sma(high_low_mid, 34)
ac = ao - ta.sma(ao, ac_length)

// RSI Calculation
rsi = ta.rsi(close, rsi_length)

// Stochastic Oscillator Calculation
k = ta.sma(ta.stoch(close, high, low, stoch_k), stoch_d)
d = ta.sma(k, stoch_d)

// Stochastic Divergence Detection
stoch_bull_div = ta.lowest(close, 5) < ta.lowest(close[1], 5) and ta.lowest(k, 5) > ta.lowest(k[1], 5)
stoch_bear_div = ta.highest(close, 5) > ta.highest(close[1], 5) and ta.highest(k, 5) < ta.highest(k[1], 5)

// Main Divergence Detection
bullish_div = ta.lowest(close, 5) < ta.lowest(close[1], 5) and ac > ac[1] and stoch_bull_div
bearish_div = ta.highest(close, 5) > ta.highest(close[1], 5) and ac < ac[1] and stoch_bear_div

// Plot divergences
plotshape(bullish_div, title="Bullish Divergence", location=location.belowbar, color=color.green, style=shape.triangleup, size=size.small)
plotshape(bearish_div, title="Bearish Divergence", location=location.abovebar, color=color.red, style=shape.triangledown, size=size.small)

// Strategy rules
if (bullish_div)
    strategy.entry("Buy", strategy.long)
    strategy.exit("Take Profit/Stop Loss", "Buy", limit=close + tp_pips, stop=close - sl_pips)

if (bearish_div)
    strategy.entry("Sell", strategy.short)
    strategy.exit("Take Profit/Stop Loss", "Sell", limit=close - tp_pips, stop=close + sl_pips)

// Alerts
if (bullish_div)
    alert("Bullish Divergence detected! Potential Buy Opportunity", alert.freq_once_per_bar)

if (bearish_div)
    alert("Bearish Divergence detected! Potential Sell Opportunity", alert.freq_once_per_bar)