
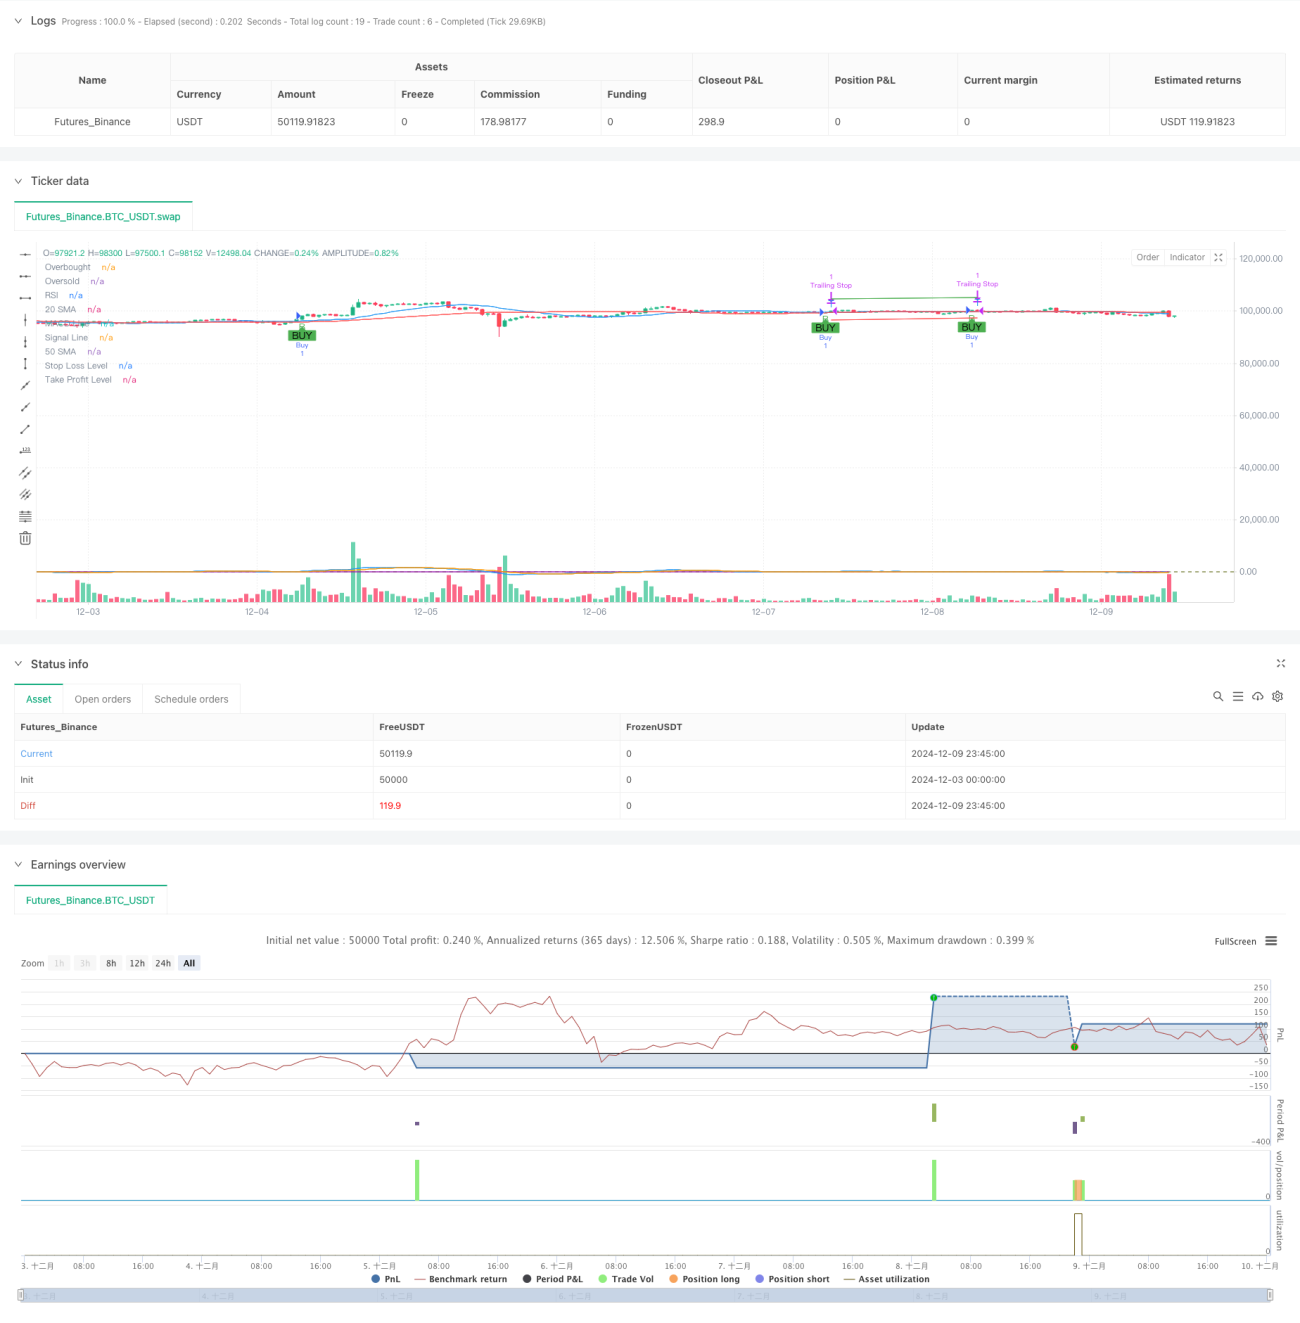
この戦略は,複数の技術指標を組み合わせたトレンド追跡取引システムである.市場動向が明確であるときにRSI (相対的に強い指標),MACD (移動平均トレンド散度),SMA (シンプル移動平均) などの複数の技術指標を統合して取引する.戦略には,より良い資金管理を実現するために,ストップ,ストップ・ロス,ストップ・ロスのようなリスク管理機構も含まれている.
この戦略は,以下の基本的な条件に基づいて取引を行います.
上記の条件が同時に満たされると,システムは複数のシグナルを発する.同時に,戦略は,5%のストップ目標,3%のストップ損失制限,2%の追跡損失を設定して,既得利益を保護する.この多層の取引条件の設計は,取引の正確性と安全性を高めるのに役立ちます.
この戦略は,複数の技術指標の配合使用によって,比較的完ぺきな取引システムを構築しています. それは,トレンドを追跡するコアロジックを含んでいるだけでなく,リスク管理の考慮も組み込んでいます. いくつかの最適化が必要な場所があるものの,全体的な枠組みは,優れた拡張性と適応性を持っています. 戦略の成功使用は,トレーダーが実際の市場状況に応じてパラメータの最適化と戦略の改善を必要とする.
/*backtest
start: 2024-12-03 00:00:00
end: 2024-12-10 00:00:00
period: 45m
basePeriod: 45m
exchanges: [{"eid":"Futures_Binance","currency":"BTC_USDT"}]
*/
//@version=5
strategy("Flexible Swing Trading Strategy with Trailing Stop and Date Range", overlay=true)
// Input parameters
rsiPeriod = input.int(14, title="RSI Period")
macdFastLength = input.int(12, title="MACD Fast Length")
macdSlowLength = input.int(26, title="MACD Slow Length")
macdSignalSmoothing = input.int(9, title="MACD Signal Smoothing")
smaShortPeriod = input.int(20, title="Short-term SMA Period")
smaLongPeriod = input.int(50, title="Long-term SMA Period")
takeProfitPercent = input.float(5.0, title="Take Profit Percentage")
stopLossPercent = input.float(3.0, title="Stop Loss Percentage")
trailingStopPercent = input.float(2.0, title="Trailing Stop Percentage")
// Date range inputs
startDate = input(timestamp("2023-01-01 00:00"), title="Start Date")
endDate = input(timestamp("2023-12-31 23:59"), title="End Date")
// Calculate RSI
rsi = ta.rsi(close, rsiPeriod)
// Calculate MACD
[macdLine, signalLine, _] = ta.macd(close, macdFastLength, macdSlowLength, macdSignalSmoothing)
// Calculate SMAs
smaShort = ta.sma(close, smaShortPeriod)
smaLong = ta.sma(close, smaLongPeriod)
// Buy condition
buyCondition = ta.crossover(macdLine, signalLine) and rsi < 70 and close > smaShort and smaShort > smaLong
// Execute buy orders within the date range
if (buyCondition )
strategy.entry("Buy", strategy.long)
// Calculate take profit and stop loss levels
takeProfitLevel = strategy.position_avg_price * (1 + takeProfitPercent / 100)
stopLossLevel = strategy.position_avg_price * (1 - stopLossPercent / 100)
// Set take profit, stop loss, and trailing stop
strategy.exit("Take Profit", "Buy", limit=takeProfitLevel)
strategy.exit("Stop Loss", "Buy", stop=stopLossLevel)
strategy.exit("Trailing Stop", "Buy", trail_price=close * (1 - trailingStopPercent / 100), trail_offset=trailingStopPercent / 100)
// Plot Buy signals
plotshape(series=buyCondition, location=location.belowbar, color=color.green, style=shape.labelup, text="BUY")
// Plot SMAs
plot(smaShort, color=color.blue, title="20 SMA")
plot(smaLong, color=color.red, title="50 SMA")
// Plot MACD and Signal Line
plot(macdLine, color=color.blue, title="MACD Line")
plot(signalLine, color=color.orange, title="Signal Line")
// Plot RSI
hline(70, "Overbought", color=color.red)
hline(30, "Oversold", color=color.green)
plot(rsi, color=color.purple, title="RSI")
// Debugging plots
plotchar(buyCondition , char='B', location=location.belowbar, color=color.green, size=size.small)
plotchar(strategy.opentrades > 0, char='T', location=location.abovebar, color=color.blue, size=size.small)
plot(stopLossLevel, color=color.red, title="Stop Loss Level")
plot(takeProfitLevel, color=color.green, title="Take Profit Level")