ボリンジャーバンドのブレイクアウトと平均回帰の4時間レベルの定量取引戦略の組み合わせ

BBANDS SMA SD TP SL
作成日: 2024-12-12 11:24:28 最終変更日: 2024-12-12 11:24:28
コピー: 0 クリック数: 568
1
フォロー
1617
フォロワー

ボリンジャーバンドのブレイクアウトと平均回帰の4時間レベルの定量取引戦略の組み合わせ

概要

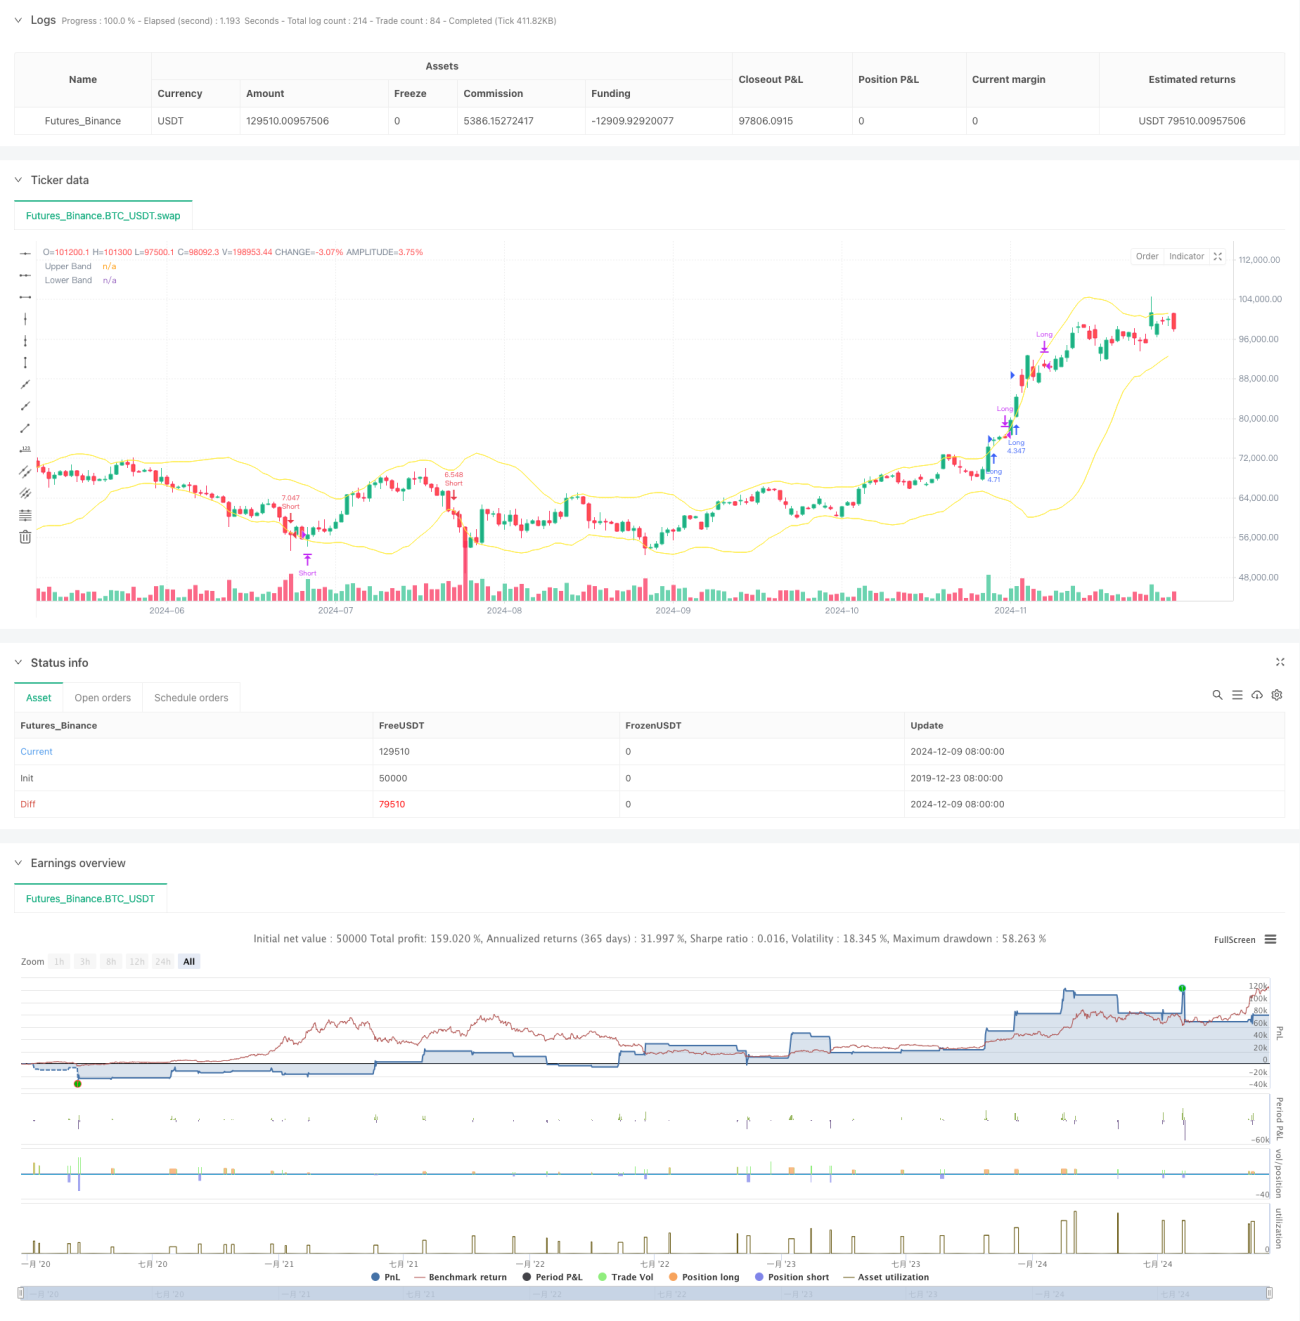
この戦略は,ブリン帯の指標に基づく4時間レベルの量化取引システムであり,トレンドの突破と平均値の逆転を組み合わせた取引理念である.この戦略は,ブリン帯の下落の突破によって市場の動きを捕捉し,価格の平均値の逆転の特性を利用して利益を得るために結束し,ストップ・ローズでリスクを制御する.この戦略は,3倍のレバレッジを採用し,収益を保証しながらも,リスク管理も十分に考慮している.

戦略原則

戦略の中核となるロジックは、次の主要な要素に基づいています。

  1. 20周期の移動平均をブリン帯の中軌道として使用し,標準差の2倍で波動区間として使用
  2. ポジション開設シグナル:K線実体 (開設価格と閉店価格の平均値) が上線突破時に多開き,下線突破時に空開き
  3. 平仓シグナル:多頭ポジションでは,連続した2つのK線の閉盘価格と開盤価格が上線価格より低く,閉盘価格が開盤価格より低い場合平仓;空頭ポジションは逆の論理を採用する
  4. リスク管理: ポジションを設定する際の現在のK線最高/最低点でストップ・ロスを設定し,単一損失を制御できるようにする.

戦略的優位性

  1. 取引論理の明晰さ:トレンドとリバースの2つの取引考え方を組み合わせて,さまざまな市場環境で良好なパフォーマンスを発揮します
  2. リスク制御の改善:K線波動に基づくダイナミックストップを設定し,撤収を効果的に制御する
  3. 偽信号をフィルターする: 閉盘価格のみではなく,K線実体位置を判断して突破を確認し,偽突破による損失を減らす
  4. 資金管理の合理性:口座権益の動向に基づいて保有規模を調整し,収益を保証し,リスクを制御する

戦略リスク

  1. 振動市場のリスク:横盤振動の状況では,偽の突破シグナルが頻繁に誘発され,連続したストップダウンの原因になる可能性があります.
  2. レバレッジのリスク: 3倍レバレッジを使用すると,急激な変動で大きな損失を招く可能性があります.
  3. 止損設定のリスク:K線最高/最低点での止損設定は,単一損失を増加させるため,過度に緩やかである可能性があります
  4. タイムサイクル依存: 4時間レベルは,特定の市場環境において,反応が遅すぎ,動きを逃す可能性があります.

戦略最適化の方向性

  1. トレンドフィルターの導入:より長い周期のトレンド判断指標を追加して,主トレンドの方向で取引することができます.
  2. 停止距離を動的に調整するためにATRまたはブリン帯域を使用することを検討する
  3. ポジション管理を増やす:波動率やトレンドの強さに応じてレバレッジ倍数を動的に調整する
  4. 市場環境判断を追加:取引量または変動率の指標を導入し,現在の市場状態を識別し,選択的にポジションを開く

要約する

これは,ブリン帯指標のトレンドフォローと平均回帰の特性を組み合わせた戦略であり,厳格なポジション開設条件とリスク管理措置により,トレンドと振動市場の両方で安定した収益を得ることができるという目標を達成する.戦略の核心的な優位性は,明確な取引論理と完善したリスク管理システムにあります.しかし,戦略の安定性と収益性をさらに向上させるために,レバレッジ使用と市場環境判断などの最適化に注意する必要があります.

ストラテジーソースコード
/*backtest
start: 2019-12-23 08:00:00
end: 2024-12-10 08:00:00
period: 1d
basePeriod: 1d
exchanges: [{"eid":"Futures_Binance","currency":"BTC_USDT"}]
*/

//@version=5
strategy("Bollinger 4H Follow", overlay=true, initial_capital=300, commission_type=strategy.commission.percent, commission_value=0.04)
// StartYear = input(2022,"Backtest Start Year") 
// StartMonth = input(1,"Backtest Start Month") 
// StartDay = input(1,"Backtest Start Day")

// testStart = timestamp(StartYear,StartMonth,StartDay,0,0)

// EndYear = input(2023,"Backtest End Year")
// EndMonth = input(12,"Backtest End Month")
// EndDay = input(31,"Backtest End Day")

// testEnd = timestamp(EndYear,EndMonth,EndDay,0,0)

lev = 3

// Input parameters
length = input.int(20, title="Bollinger Band Length")
mult = input.float(2.0, title="Bollinger Band Multiplier")

// Bollinger Bands calculation
basis = ta.sma(close, length)
upperBand = basis + mult * ta.stdev(close, length)
lowerBand = basis - mult * ta.stdev(close, length)

// Conditions for Open Long
openLongCondition = strategy.position_size == 0 and close > open and (close + open) / 2 > upperBand

// Conditions for Open Short
openShortCondition = strategy.position_size == 0 and close < open and (close + open) / 2 < lowerBand

// Conditions for Close Long
closeLongCondition = strategy.position_size > 0 and strategy.position_size > 0 and (close < upperBand and open < upperBand and close < open)

// Conditions for Close Short
closeShortCondition = strategy.position_size < 0 and strategy.position_size < 0 and (close > lowerBand and open > lowerBand and close > open)


// Long entry
if openLongCondition
    strategy.entry("Long", strategy.long, qty=strategy.equity * lev / close)
    strategy.exit("Long SL", from_entry="Long", stop=low)  // Set Stop-Loss

// Short entry
if openShortCondition
    strategy.entry("Short", strategy.short, qty=strategy.equity * lev / close)
    strategy.exit("Short SL", from_entry="Short", stop=high)  // Set Stop-Loss

// Long exit
if closeLongCondition
    strategy.close("Long", comment = "TP")

// Short exit
if closeShortCondition
    strategy.close("Short", comment = "TP")

// Plot Bollinger Bands
plot(upperBand, color=color.yellow, title="Upper Band")
plot(lowerBand, color=color.yellow, title="Lower Band")