
1
Follow
1802
Followers
概要
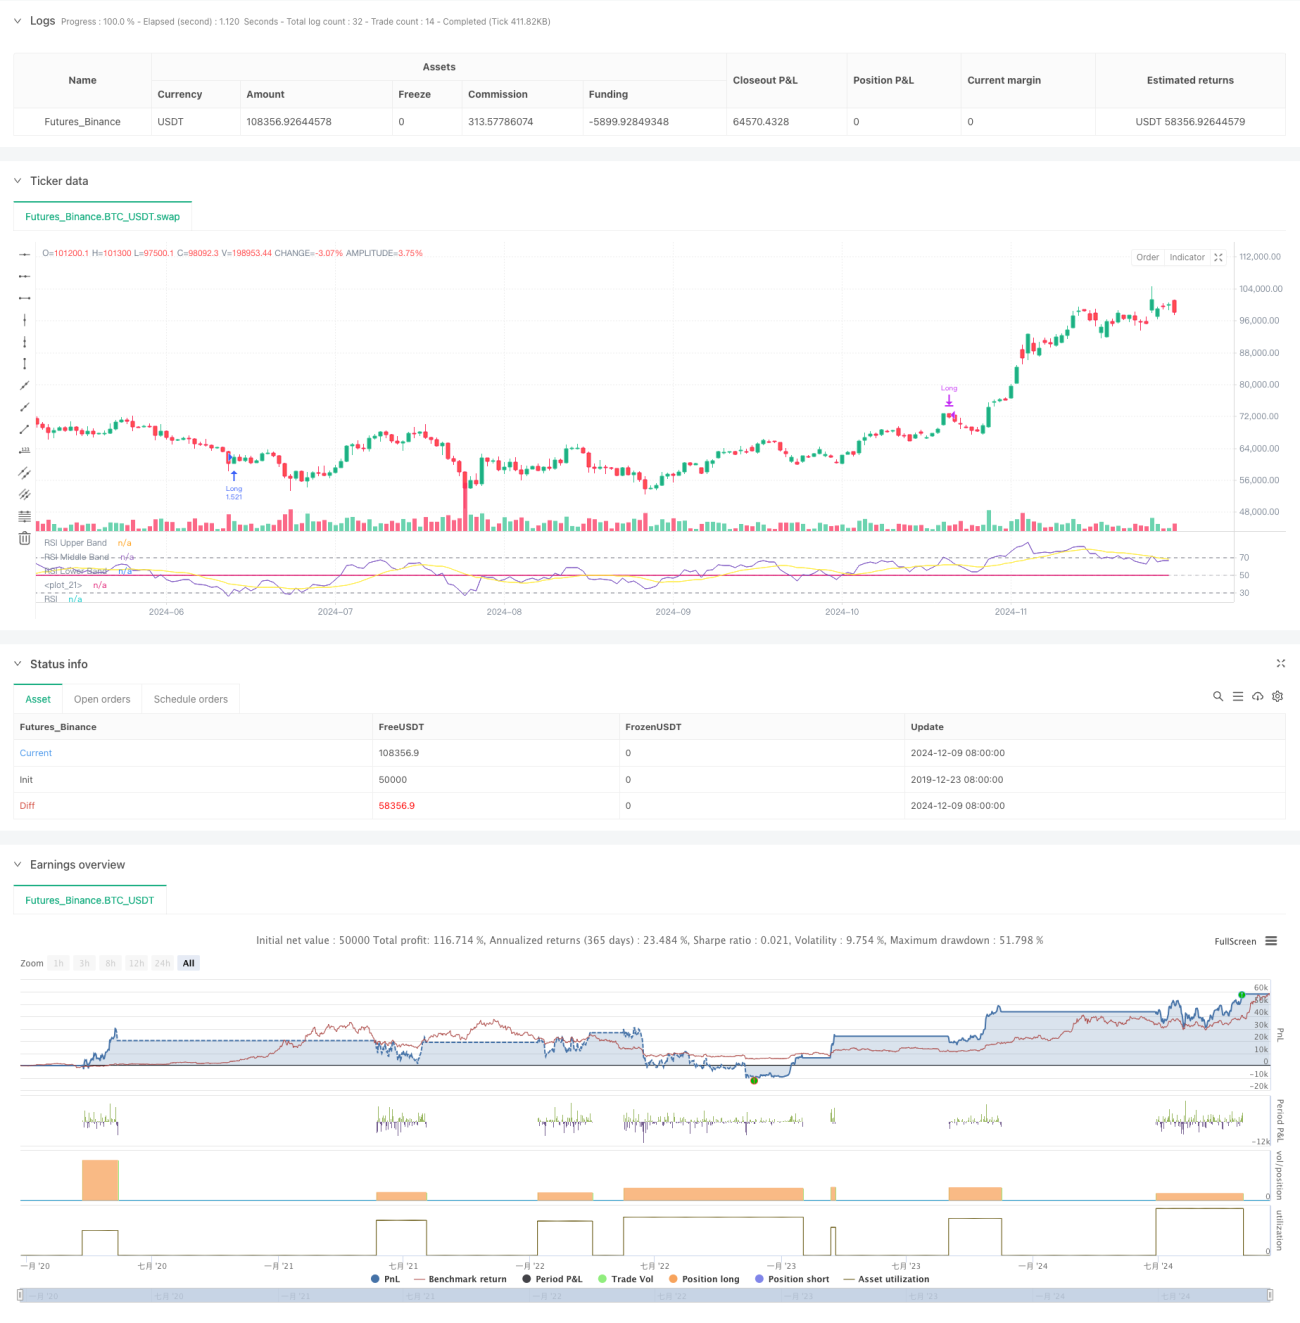
本戦略は、相対力指数(RSI)を基盤としたインテリジェントな取引システムであり、複数の移動平均線とボリンジャーバンド指標を組み合わせ、市場の買われ過ぎ・売られ過ぎ領域を識別してタイミング取引を行います。戦略の核心は、RSIの突破と反落シグナルを利用し、異なるタイプの移動平均線でトレンドを確認することで、効率的なスイングトレードを実現します。本戦略は適応性が高く、異なる市場環境に応じてパラメータを調整できます。
戦略の原理
戦略では14期間のRSIを中核指標とし、RSIと30/70という2つの重要水準のクロスを監視して取引シグナルを生成します。RSIが30を上抜けた場合、市場が売られ過ぎから強気に転換したと判断し、買いシグナルを発します。RSIが70を下抜けた場合、市場が買われ過ぎから弱気に転換したと判断し、決済シグナルを発します。同時に、戦略では複数の移動平均線(SMA、EMA、SMMA、WMA、VWMA)とボリンジャーバンドを補助指標として導入し、トレンド方向や市場のボラティリティを確認します。
戦略の優位性
- 明確なシグナル:RSI指標による買われ過ぎ・売られ過ぎのシグナルは明確で、理解・実行が容易です。
- リスク管理が可能:明確なエントリーとエグジット条件を設定することで、リスクを効果的に管理します。
- 柔軟性が高い:複数の移動平均線タイプに対応しており、市場状況に応じて柔軟に切り替えられます。
- 自己適応性:ボリンジャーバンドは市場のボラティリティに応じて取引レンジを自動調整します。
- 最適化が容易:パラメータ調整が容易で、異なる市場状況に応じて最適化できます。
戦略のリスク
- レンジ相場のリスク:値動きの乏しいレンジ相場では、偽のブレイクアウトシグナルが頻発する可能性があります。
- トレンド継続リスク:早期にポジションを決済すると、大きなトレンドを見逃す可能性があります。
- パラメータ感応度:異なるパラメータ設定により、戦略のパフォーマンスに大きな差が生じる可能性があります。
- スリッページの影響:流動性の低い市場では大きなスリッページが発生する可能性があります。
- システムリスク:極端な市場環境では連続した損失が発生する可能性があります。
戦略の最適化方向性
- 出来高指標の導入:出来高でシグナルの有効性を確認します。
- トレンドフィルターの追加:より長い期間のトレンド判断と組み合わせて、逆張り取引を回避します。
- ストップロスメカニズムの最適化:動的ストップロスを導入し、資金効率を向上させます。
- ポジション管理の改善:市場のボラティリティに応じてポジションサイズを動的に調整します。
- 市場センチメント指標の追加:他のテクニカル指標と組み合わせてシグナルの精度を高めます。
まとめ
本戦略はRSI指標で市場の買われ過ぎ・売られ過ぎの機会を捉え、複数のテクニカル指標でシグナルを確認することで、実用性と信頼性に優れています。戦略設計ではリスク管理を十分に考慮し、パラメータ最適化と指標の組み合わせにより、様々な市場環境に適応できます。トレーダーは実際の取引に使用する前に、十分なバックテスト検証を行い、具体的な市場特性に応じてパラメータ設定を調整することを推奨します。
Source
Pine
/*backtest
start: 2019-12-23 08:00:00
end: 2024-12-10 08:00:00
period: 1d
basePeriod: 1d
exchanges: [{"eid":"Futures_Binance","currency":"BTC_USDT"}]
*/

//@version=5
strategy(title="Demo GPT - Relative Strength Index", shorttitle="RSI Strategy", overlay=false, default_qty_type=strategy.percent_of_equity, default_qty_value=100, commission_value=0.1, slippage=3)

// InputsStrategy parameters
Related strategies
Comment
All comments (0)
No data
- 1