1
フォロー
1750
フォロワー
概要
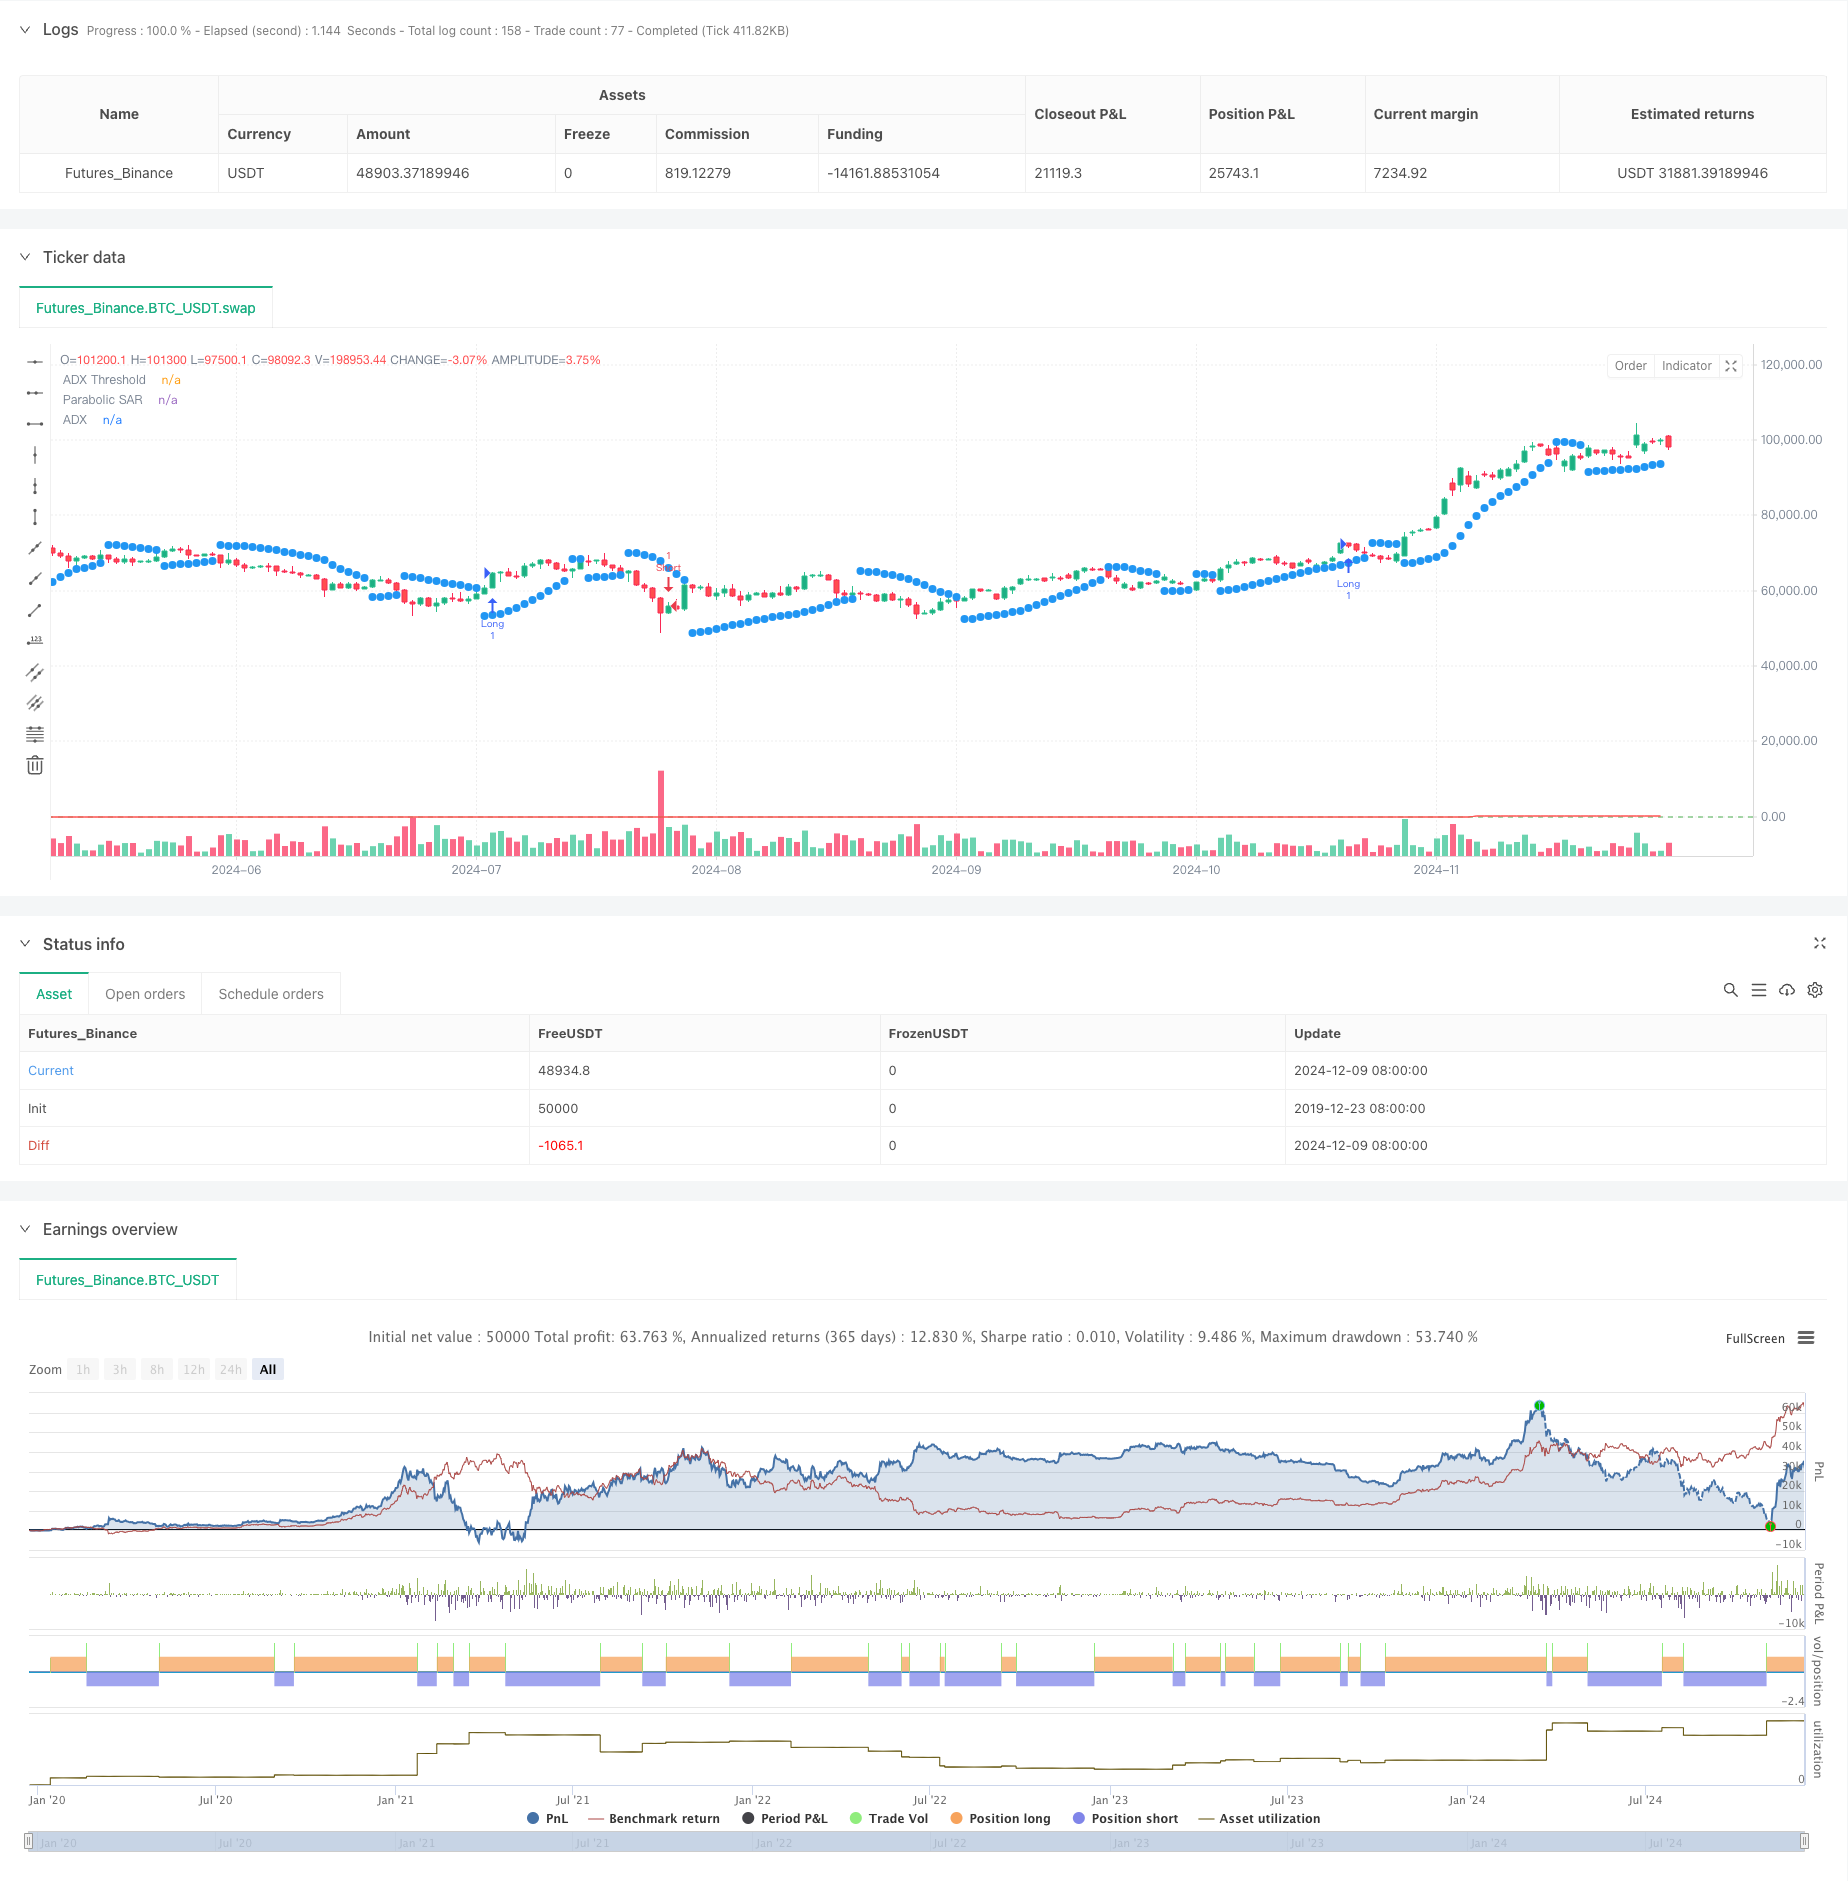
この戦略は,平均トレンド指数 ((ADX) とパラパラ線ストップ・ロース・ターニング指数 ((SAR) を組み合わせたトレンド追跡取引システムである.このシステムは,トレンドの強さをADXで測定し,トレンドの方向を確認するためにSARを使用し,強いトレンドの市場での取引機会をキャプチャします.システムは,トレンドの存在を保証するだけでなく,トレンドの信頼性を検証する二重確認の仕組みを採用します.
戦略原則
戦略の核心的な論理は,以下の重要な要素に基づいています.
- ADX指標は,トレンドの強さを測定するために使用され,ADX値が25を超えると,市場には明らかな傾向があることを示す.
- DI+とDI−の交差は,トレンドの方向を判断するために使用される.DI+がDI−より大きいときは上昇傾向を表し,逆に下降傾向を表す.
- パラロイドSARは,ストップポイントを動的に調整することで価格の動きを追跡し,トレンドの方向に追加の確認を提供します.
取引シグナルのトリガー条件は次のとおりです。
- 多条件:ADX>25とDI+>DI-と価格がSAR上にある
- 空白条件:ADX>25とDI->DI+と価格がSAR以下である
- 平仓条件:逆の取引シグナルが発生した場合
戦略的優位性
- 双重確認メカニズムは取引信号の信頼性を大幅に高めています.
- ダイナミック・ストップ・ダメージ設定は,保護を有効にします
- パラメータはさまざまな市場環境に適応できるよう高度に調整可能
- 戦略ロジックは明確で、理解しやすく、実行しやすい
- トレンドの強い市場での優れたパフォーマンス
戦略リスク
- 不安定な市場では誤ったシグナルが頻繁に発生する可能性がある
- 市場が成長する傾向が遅れている
- 急速な逆転により,より大きな撤退が予想される.
- 不適切なパラメータ設定は戦略のパフォーマンスに影響を与える可能性があります
リスク管理の提案:
- 設定する最大撤回制限
- 市場変動による調整パラメータ
- 他の技術指標と組み合わせた取引確認
- ポジション管理戦略の実施
戦略最適化の方向性
波動率指標の調整パラメータを導入する
- ADX 値の上昇
- 低波動期におけるSAR感受性の低下
出場メカニズムの最適化
- 利益の目標を追加する
- ダイナミックな止損策を設計する
市場環境のフィルターを増やすこと
- トレンドライン分析
- 取引量も考慮する
ポジション管理の改善
- ATR に基づく設計ポジションサイズ
- 倉庫の建設/平成を実現
要約する
この戦略はADXとSARの指標を組み合わせて,堅牢なトレンド追跡システムを構築している.戦略の主要な優点は,その二重確認機構とダイナミックな止損設定にあるが,揺れ動いている市場では不十分なパフォーマンスを発揮する可能性がある.合理的なパラメータ最適化とリスク管理により,この戦略は,傾向が顕著な市場環境で良好なパフォーマンスを発揮できる.
ストラテジーソースコード
/*backtest
start: 2019-12-23 08:00:00
end: 2024-12-10 08:00:00
period: 1d
basePeriod: 1d
exchanges: [{"eid":"Futures_Binance","currency":"BTC_USDT"}]
*/

// This Pine Script™ code is subject to the terms of the Mozilla Public License 2.0 at https://mozilla.org/MPL/2.0/
// © traderhub

//@version=5
strategy("Trend Following ADX + Parabolic SAR", overlay=true)

// Strategy parameters
adxLength = input(14, title="ADX Period")
adxThreshold = input(25, title="ADX Threshold")
adxSmoothing = input(14, title="ADX Smoothing")
sarStart = input(0.02, title="Parabolic SAR Start")  // Starting acceleration factor
sarIncrement = input(0.02, title="Parabolic SAR Increment")  // Increment step
sarMax = input(0.2, title="Parabolic SAR Max")  // Maximum acceleration factor

// Calculate ADX, DI+, and DI-
[diPlus, diMinus, adx] = ta.dmi(adxLength, adxSmoothing)

// Parabolic SAR calculation
sar = ta.sar(sarStart, sarIncrement, sarMax)

// Conditions for a long position
longCondition = adx > adxThreshold and diPlus > diMinus and close > sar

// Conditions for a short position
shortCondition = adx > adxThreshold and diMinus > diPlus and close < sar

// Enter a long position
if (longCondition)
    strategy.entry("Long", strategy.long)

// Enter a short position
if (shortCondition)
    strategy.entry("Short", strategy.short)

// Close position on reverse signal
if (strategy.position_size > 0 and shortCondition)
    strategy.close("Long")
if (strategy.position_size < 0 and longCondition)
    strategy.close("Short")

// Plot indicators on the chart
plot(sar, color=color.blue, style=plot.style_circles, linewidth=2, title="Parabolic SAR")
plot(adx, color=color.red, title="ADX")
hline(adxThreshold, "ADX Threshold", color=color.green)