
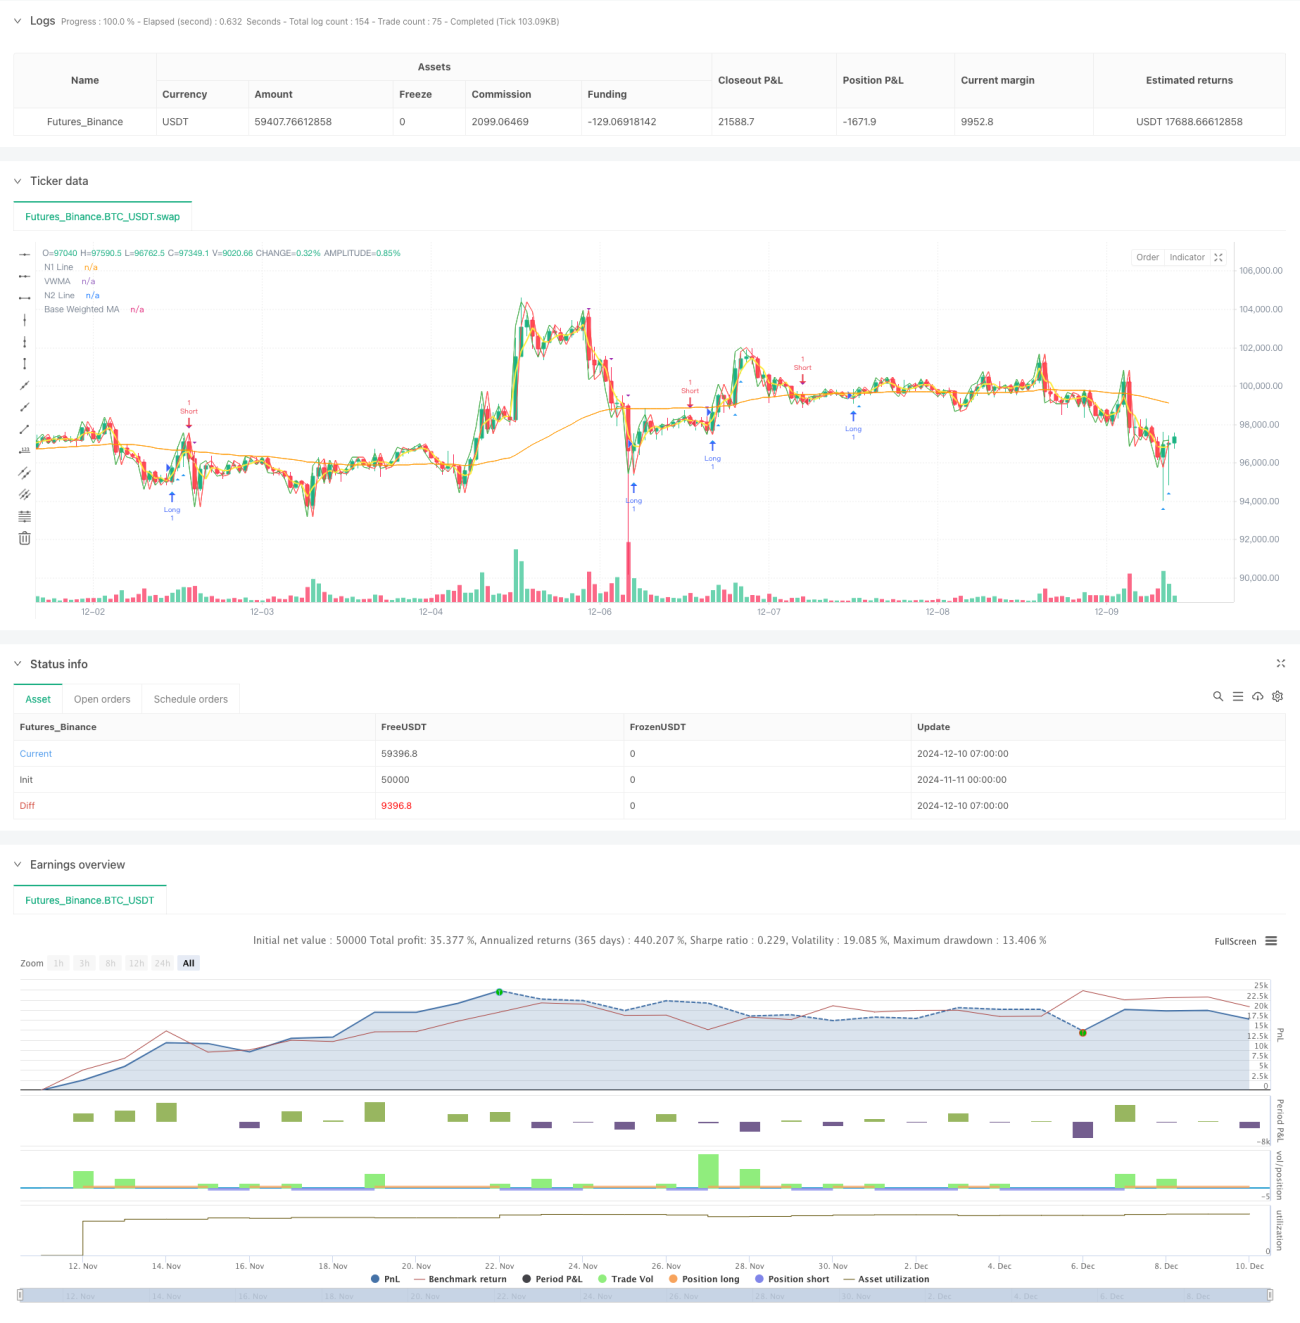
この戦略は,複数の平均線,相対的に強い指標 ((RSI),平均トレンド指標 ((ADX) と取引量分析を組み合わせた総合的な量化取引システムである. 戦略は,複数の技術指標の協調的な配合によって,トレンド確認に基づいて取引を行い,取引量と動量指標のフィルタリングによって取引の信頼性を高めます.
戦略の中核となるロジックは、次の主要な要素に基づいています。
多重平均線システムは価格の傾向を基準として提供し,ADXはトレンドが十分に強いときにのみ取引を保証し,RSIは落を避けるのを助け,取引量分析は取引が市場活動性の高い時期に発生することを保証する.
リスク管理には以下の方法が推奨されています.
この戦略は,複数の技術指標の協調的な配合によって,比較的完ぺきなトレンド追跡システムを構築している.この戦略の主な特徴は,複数の確認によって取引の信頼性を高め,様々なフィルターによってリスクを制御することです.いくつかの取引機会を逃す可能性があるが,全体的に取引の安定性を高めるのに役立ちます.提案された最適化方向によって,この戦略にはさらに向上する余地があります.
/*backtest
start: 2024-11-11 00:00:00
end: 2024-12-10 08:00:00
period: 1h
basePeriod: 1h
exchanges: [{"eid":"Futures_Binance","currency":"BTC_USDT"}]
*/
//@version=5
strategy("Optimized Multi-MA Strategy with Volume, ADX and RSI", overlay=true)
// Kullanıcı Parametreleri
keh = input.int(3, title="Double HullMA", minval=1)
teh = input.int(3, title="Volume-Weighted MA", minval=1)
yeh = input.int(75, title="Base Weighted MA", minval=1)
rsiPeriod = input.int(14, title="RSI Period", minval=1)
adxPeriod = input.int(14, title="ADX Period", minval=1)
volumeLookback = input.int(10, title="Volume Lookback Period", minval=1) // Son X mumun hacmi
adxThreshold = input.int(20, title="ADX Trend Strength Threshold", minval=1) // ADX için trend gücü eşiği
// Hareketli Ortalamalar
rvwma = ta.vwma(close, teh)
yma = ta.wma(close, yeh)
n2ma = 2 * ta.wma(close, math.round(keh / 2))
nma = ta.wma(close, keh)
diff = n2ma - nma
sqrtKeh = math.round(math.sqrt(keh))
n1 = ta.wma(diff, sqrtKeh)
n2 = ta.wma(diff[1], sqrtKeh)
// ADX Hesaplaması
trueRange = ta.rma(ta.tr, adxPeriod)
plusDM = ta.rma(math.max(high - high[1], 0), adxPeriod)
minusDM = ta.rma(math.max(low[1] - low, 0), adxPeriod)
plusDI = (plusDM / trueRange) * 100
minusDI = (minusDM / trueRange) * 100
dx = math.abs(plusDI - minusDI) / (plusDI + minusDI) * 100
adx = ta.rma(dx, adxPeriod)
trendIsStrong = adx > adxThreshold
// RSI Filtreleme
rsiValue = ta.rsi(close, rsiPeriod)
rsiFilter = rsiValue > 30 and rsiValue < 70 // Aşırı alım ve aşırı satım bölgelerinin dışında olmak
// Hacim Filtresi
volumeThreshold = ta.sma(volume, volumeLookback) // Ortalama hacim seviyesi
highVolume = volume > volumeThreshold
// Sinyal Şartları (Sadece güçlü trendler ve rsi'nın aşırı bölgelerde olmaması)
longCondition = n1 > n2 and close > rvwma and trendIsStrong and rsiFilter and highVolume
shortCondition = n1 < n2 and close < rvwma and trendIsStrong and rsiFilter and highVolume
// Hacim Filtresi ile İşaretler
plotshape(series=longCondition and highVolume ? close : na, style=shape.triangleup, location=location.belowbar, color=color.blue, size=size.small, title="High Volume Long Signal")
plotshape(series=shortCondition and highVolume ? close : na, style=shape.triangledown, location=location.abovebar, color=color.purple, size=size.small, title="High Volume Short Signal")
// Strateji Giriş ve Çıkış Şartları
if (longCondition)
strategy.entry("Long", strategy.long)
if (shortCondition)
strategy.entry("Short", strategy.short)
// Görsel Göstergeler
plot(n1, color=color.green, title="N1 Line")
plot(n2, color=color.red, title="N2 Line")
plot(rvwma, color=color.yellow, linewidth=2, title="VWMA")
plot(yma, color=color.orange, title="Base Weighted MA")