
1
Follow
1781
Followers
概要
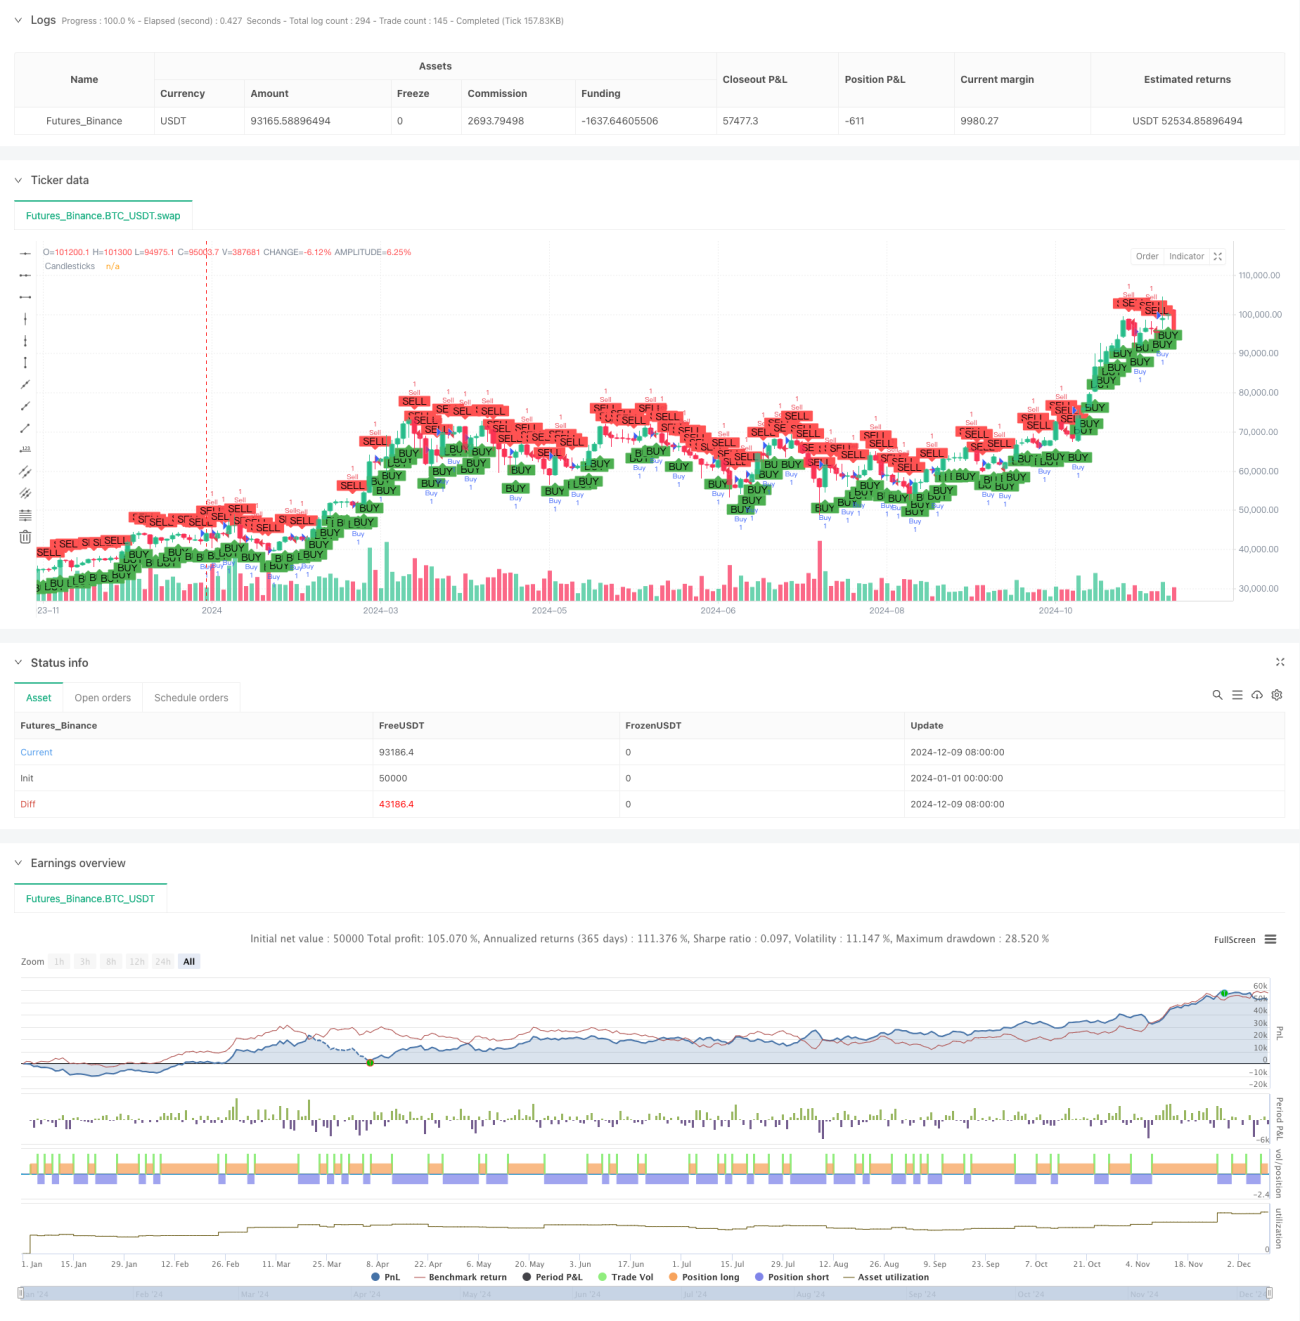
これは,1分間のK線閉店方向に基づく高頻度取引を行う戦略である.戦略は,K線の閉店価格と開店価格の関係を判断して市場の動きを決定し,看板K線が形成された後に多行し,看板K線が形成された後に空行する.戦略は,固定したポジション保持時間を採用し,次のK線閉店時にポジションを平行させ,最大日取引回数に制限を設け,リスクを制御する.
戦略原則
戦略の核心的な論理は,K線の閉店方向から短期市場の傾向を判断することです.
- 閉盤価格が開盤価格より高いとき,陽線が形成され,現在の周期で買い手の力が優位であり,戦略の選択が多くなることを示す.
- 閉盤価格が開盤価格より低いとき,陰線が形成され,現在の周期で売り手の力が優位であることを示す. 策略は空白を選択する.
- 戦略は,開設後の次のK線が閉じる時に平仓を立て,迅速な利益を得たり,損失を止めたりします.
- 過剰取引を防ぐために,毎日200回の取引を制限します.
- 取引ごとに口座の1パーセントの資金が使用され,リスクコントロールを実現する.
戦略的優位性
- 取引の論理はシンプルで明快で,理解し,実行しやすい.
- 市場波動によるリスクを減らすため,ポジションを短期間保持する
- 固定保有期間により,主観的な判断による偏差を回避
- リスクの管理に有効な日当たりの最大取引数制限が設定されています.
- %リスク管理を使用して,口座の資金の安全性を確保します.
- 戦略の監視と最適化のための取引信号の視覚化
戦略リスク
- 高周波取引は高取引コストを伴う可能性があります.
解決策: 取引の種類を比較し,取引のタイミングを最適化する - 市場が激しく波動する中で,連續的に損失を被る可能性
解決策: 市場の変動をフィルターする条件を増やす - 戦略は偽の突破によって影響を受ける
解決策: 取引量増加などの補助指標を確認する - 固定資産保有は,より大きな利益の機会を逃す可能性があります.
解決策: 市場状況に応じてポジション保持時間を動的に調整する - 市場情報や技術指標を考慮していない
解決策:他の技術指標と組み合わせた 入学条件の最適化
戦略最適化の方向性
- 取引量指標の導入:取引量によってK線の有効性を確認し,取引信号の信頼性を向上させる
- トレンドフィルターを追加: メアラインなどのトレンド指標を組み合わせて,主要トレンドの方向で取引する
- ダイナミックなポジション保持時間:市場の変動率に応じてポジション保持時間を動的に調整し,戦略の適応性を向上させる
- 資金管理の最適化: ポジションサイズの動的調整
- 市場変動のフィルタを増やす: 市場変動が過大または過小である場合に取引を停止する
- タイムフィルターを追加: 波動の多い市場開店と閉店を避ける
要約する
この戦略は,K線の閉店方向に基づく高周波取引システムで,簡単な価格行動分析によって短期市場の機会を捉えます.この戦略の優点は,論理的にシンプルで,ポジションの維持時間が短く,リスクが制御可能であることですが,同時に,取引コストが高く,偽ブレークなどの課題に直面しています.より多くの技術指標と最適化プログラムを導入することにより,戦略の安定性と収益性がさらに向上する見込みがあります.短期取引機会を追求する投資家にとって,これは試し,改善する価値のある取引戦略です.
Source
Pine
Comment
All comments (0)
No data
- 1