マルチ期間ボリンジャーバンドはトレンド反転の定量的取引戦略に触れる

1
Follow
1781
Followers
概要
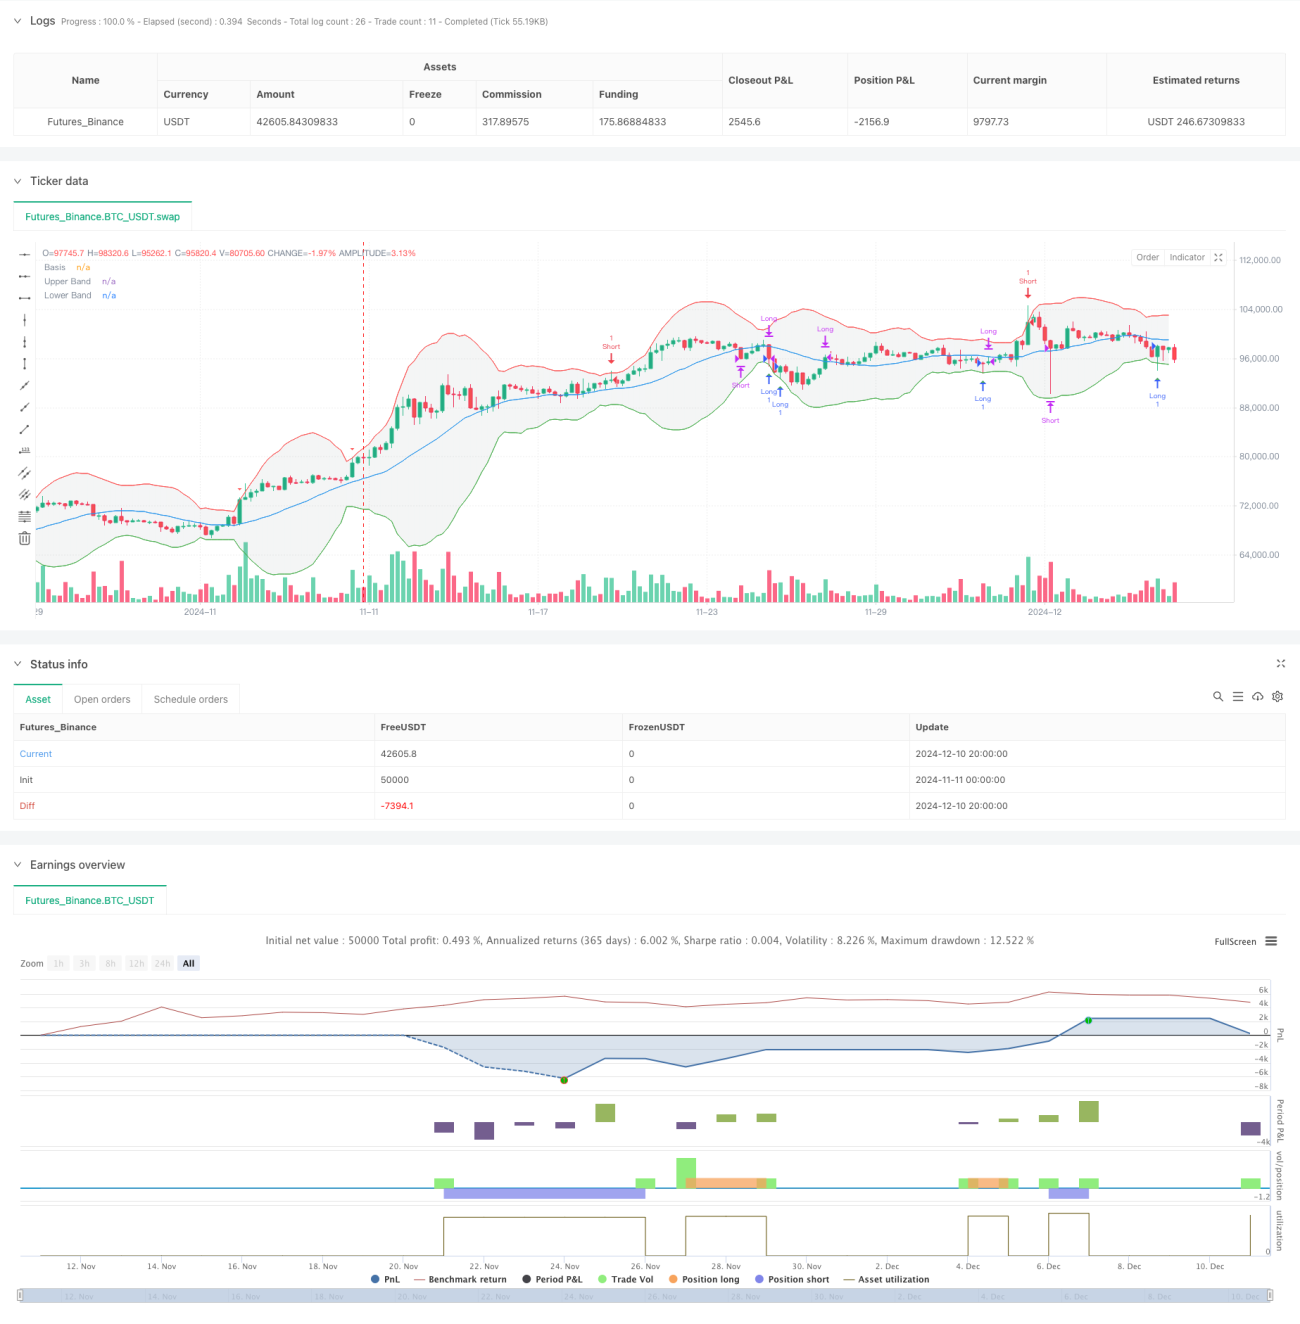
この戦略は,ブリン帯の指標に基づくトレンド反転取引システムで,価格とブリン帯の接触関係を監視することで,市場の反転の機会を捉える.この戦略は5分間の時間周期で動作し,20周期の移動平均をブリン帯の中央軌道として使用し,ブリン帯の上下走行のパラメータとして3.4倍標準差を設定します.価格がブリン帯の上下走行に触れたときに,システムは対応する取引信号を発信します.
戦略原則
戦略の核心的な論理は,価格回帰理論に基づいています. 価格がブリンを下回る軌道に触れたとき,システムは市場が過剰に売り切れたと判断し,過剰に売る傾向があります. 価格がブリンを下回る軌道に触れたとき,システムは市場が過剰に売り切れたと判断し,空売りする傾向があります.具体的には:
- 複数条件: 5分間のK線最低値がブリン帯下軌に初めて触れたときまたは突破したとき ((現在のK線最低値<=下軌,前のK線最低値>下軌)
- 空気条件: 5分間のK線最高値がブリン帯を初めて触れたときまたは突破したとき (現在のK線最高値>=上線,前K線最高値<上線)
- 出発条件:価格がブリン帯の中軌道時平仓に戻る
戦略的優位性
- 指数の選択は合理的:ブリン帯はトレンドと波動率の情報を統合し,市場状況を効果的に識別します.
- 入場時刻精度:ブリンに初めて触れたことで反転信号を捕まえ,追撃を回避
- 風力制御の論理の完善:移動平均を止まり基準として使用し,利潤を保護し,早めに出場しない
- パラメータ配置科学:3.4倍標準差の設定は,偽信号を効果的にフィルタリングできる
- システム構造の明晰さ:取引ロジックはシンプルで直感的で,維持と最適化が容易である
戦略リスク
- トレンド突破リスク: 強いトレンドの市場では,価格がブルイン帯を突破し続けることがあり,頻繁にストップが起こる.
- 変動の市場リスク: 区間変動の時には,偽信号が多すぎて取引コストが上がる可能性があります.
- パラメータの感受性:ブリン帯のパラメータの微妙な変更は,戦略のパフォーマンスに大きな影響を与える可能性があります.
- スライドポイントの影響: 高い変動率の環境で,戦略のパフォーマンスを悪化させる重大なスライドポイントに直面する可能性があります.
- タイムサイクル依存: 戦略のパフォーマンスが異なるタイムサイクルで大きく異なる可能性があります.
戦略最適化の方向性
- 複数の時間周期:より長い周期のブリン帯確認を導入し,信号の信頼性を向上させる
- トレンドフィルター:トレンド判断の指標を追加し,トレンドの方向が明確になったときにポジションを開きます.
- ダイナミックパラメータ:市場の波動率に適応したブリン帯パラメータ
- 止損最適化:風制御の効果を高めるために,止損追跡またはATRベースの止損を設定する
- ポジション管理:シグナル強度と市場の変動率の動向に応じてポジション保持比率を調整する
要約する
この戦略は,ブリン帯の接触によって市場逆転の機会を捕捉し,論理的明晰さ,リスク制御の合理的な特性を有する.合理的なパラメータ設定と完善な取引規則により,戦略は,振動的な市場において良好な安定性を表している.しかし,実況適用では,トレンド突破リスクに注意する必要がある.他の技術指標と組み合わせた取引確認を推奨し,市場状況に応じて戦略パラメータの動向を調整する.最適化の方向は,主に多周期協調,トレンドフィルタリング,動向パラメータの調整などの側面に焦点を当てている.
Source
Pine
Strategy parameters
Related strategies
Comment
All comments (0)
No data
- 1