ボリンジャーバンドトレンドブレイクスルー強化された定量戦略とインジケーターモメンタムフィルターシステムの組み合わせ

BB RSI EMA ATR RR
作成日: 2024-12-12 14:55:37 最終変更日: 2024-12-12 14:55:37
コピー: 3 クリック数: 371
1
フォロー
1617
フォロワー

ボリンジャーバンドトレンドブレイクスルー強化された定量戦略とインジケーターモメンタムフィルターシステムの組み合わせ

概要

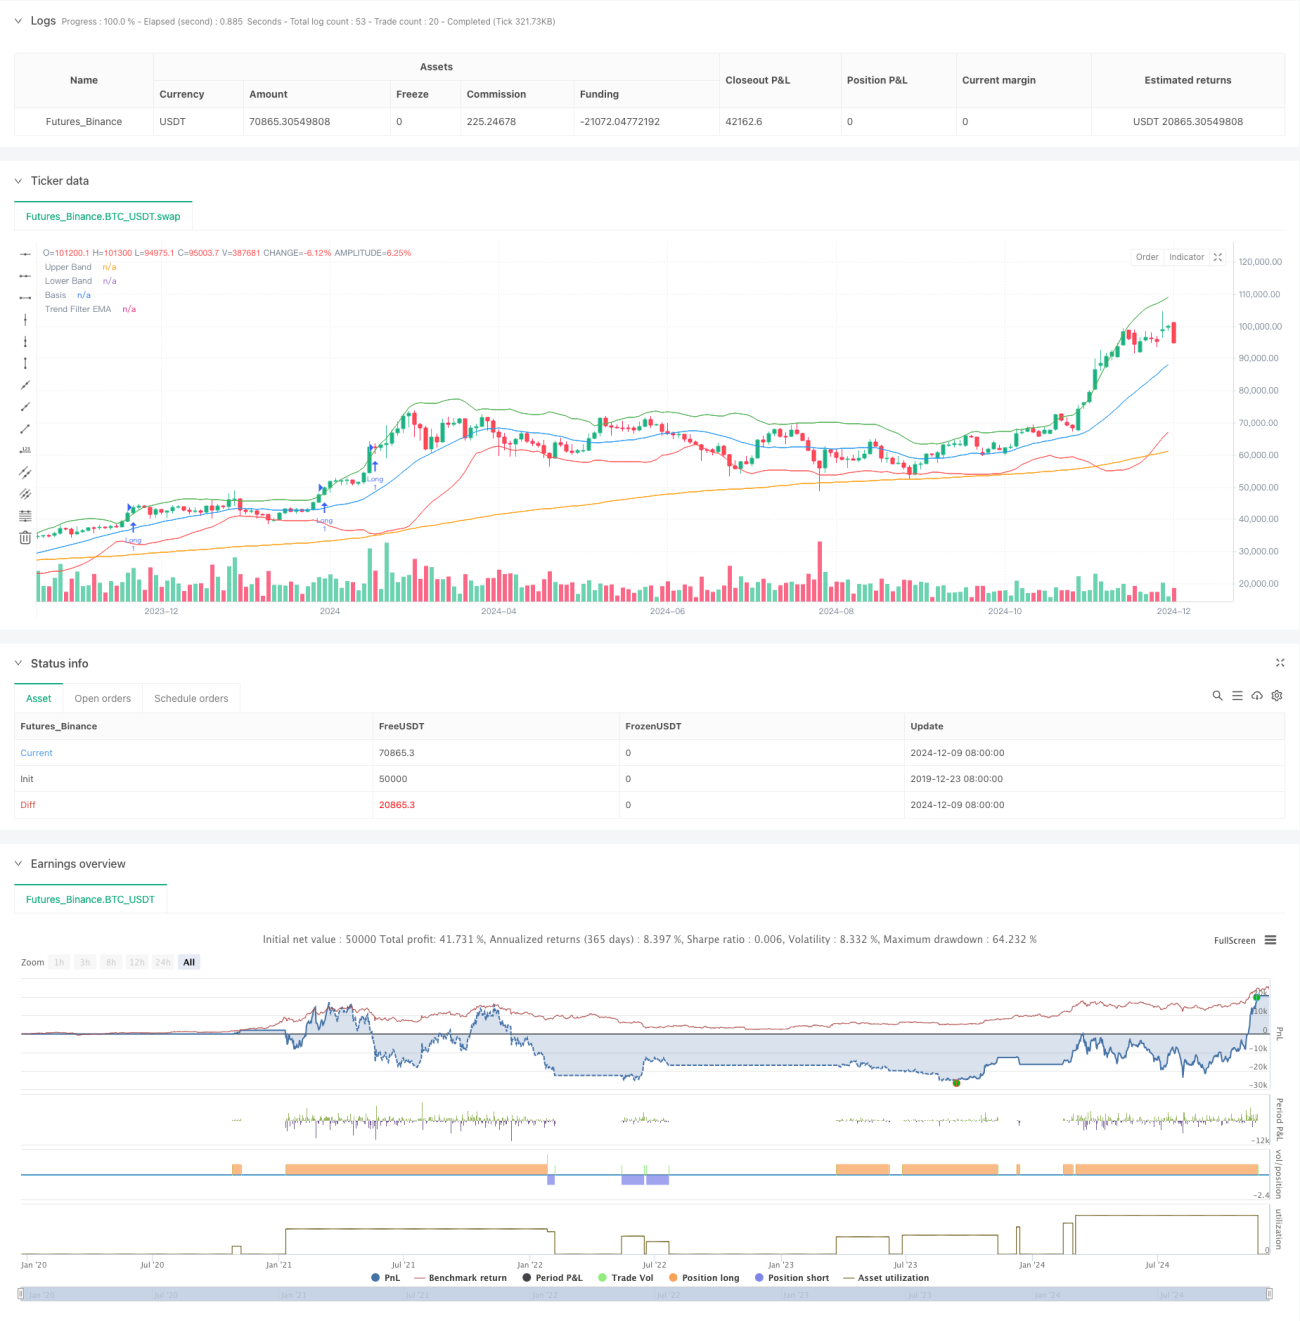
この戦略は,ブリン帯,RSI指標と200サイクルEMAのトレンドフィルターを組み合わせた高度な量化取引システムである.この戦略は,複数の技術指標の協調的な配合によって,トレンドの方向で高確率の突破の機会を捉え,揺れ動いている市場で偽の信号を効果的にフィルタリングします.システムは,ダイナミックな止損とリスクと利益の比率に基づいた収益目標設定を採用し,安定した取引パフォーマンスを実現することを目指しています.

戦略原則

戦略の核心的な論理は以下の3つのレベルに基づいています.

  1. ブリン帯突破シグナル: ブリン帯の上下軌道を波動率通路として利用し,価格突破上軌道は多行シグナルとして,下軌道は空行シグナルとして破る.
  2. RSI動態確認:RSIは50以上で確認して多動態を行う,50以下で確認して空調動態を行う,トレンドがない時に取引を避ける.
  3. EMAトレンドフィルター: 200サイクルEMAを使って主トレンドを判断し,トレンドの方向のみでポジションを開きます.価格はEMAの上で多し,下の空しです.

取引の確認には以下の条件が必要です.

  • 連続した2つのK線が突破状態を維持
  • 20周期平均より高い取引量
  • 動的ストップはATR値に基づいて計算される.
  • 利益目標は1.5倍のリスクと利益の比率に基づいています.

戦略的優位性

  1. 複数の技術指標の協同フィルタリングにより,信号の質が著しく向上
  2. 市場変動に適応するダイナミックなポジション管理機構
  3. 厳格な取引確認メカニズムにより,偽の信号を減らすことができます.
  4. ダイナミック・ストップ・ローズと固定リスク・リターン・レートを含む完全なリスク管理システム
  5. 柔軟なパラメータの最適化空間,異なる市場環境に対応

戦略リスク

  1. 過度なパラメータ最適化は過剰適合につながる可能性がある
  2. 市場が急激に波動すると,頻繁にストップダウンは起こりうる.
  3. 市場が揺れ動いてしまうと 損失が続く可能性
  4. トレンド転換点の信号が遅れている
  5. 技術指標の間で矛盾する信号が出る可能性

リスク管理の提案:

  • 損害賠償制度の厳格な執行
  • 単一取引のリスクをコントロールする
  • パラメータの有効性を定期的にテストする
  • 基本的な分析と組み合わせたものです
  • 過剰な取引を避ける

戦略最適化の方向性

  1. 相互検証の技術指標を導入する
  2. 適応パラメータ最適化メカニズムの開発
  3. 市場感情指標を追加
  4. トランザクション確認の最適化
  5. より柔軟なポジション管理システム開発

デザインの基本は

  • 異なる市場周期の動向に合わせて調整するパラメータ
  • 取引のフィルタリング条件を追加
  • リスクと利益の相関を最適化する設定
  • 損失を抑える仕組みの改善
  • よりスマートな信号認証システム

要約する

この戦略は,ブリン帯,RSI,EMAなどの技術指標を有機的に組み合わせることで,完全な取引システムを構築している.システムは,取引の質を保証しながら,厳格なリスク制御と柔軟なパラメータ最適化スペースによって,強力な実戦アプリケーション価値を示している.トレーダーは,リアルでパラメータを慎重に検証し,取引の規律を厳格に執行し,戦略のパフォーマンスを継続的に最適化することを推奨している.

ストラテジーソースコード
/*backtest
start: 2019-12-23 08:00:00
end: 2024-12-10 08:00:00
period: 2d
basePeriod: 2d
exchanges: [{"eid":"Futures_Binance","currency":"BTC_USDT"}]
*/

//@version=5
strategy("Improved Bollinger Breakout with Trend Filtering", overlay=true)

// === Inputs ===
length = input(20, title="Bollinger Bands Length", tooltip="The number of candles used to calculate the Bollinger Bands. Higher values smooth the bands, lower values make them more reactive.")
mult = input(2.0, title="Bollinger Bands Multiplier", tooltip="Controls the width of the Bollinger Bands. Higher values widen the bands, capturing more price movement.")
rsi_length = input(14, title="RSI Length", tooltip="The number of candles used to calculate the RSI. Shorter lengths make it more sensitive to recent price movements.")
rsi_midline = input(50, title="RSI Midline", tooltip="Defines the midline for RSI to confirm momentum. Higher values make it stricter for bullish conditions.")
risk_reward_ratio = input(1.5, title="Risk/Reward Ratio", tooltip="Determines the take-profit level relative to the stop-loss.")
atr_multiplier = input(1.5, title="ATR Multiplier for Stop-Loss", tooltip="Defines the distance of the stop-loss based on ATR. Higher values set wider stop-losses.")
volume_filter = input(true, title="Enable Volume Filter", tooltip="If enabled, trades will only execute when volume exceeds the 20-period average.")
trend_filter_length = input(200, title="Trend Filter EMA Length", tooltip="The EMA length used to filter trades based on the market trend.")
trade_direction = input.string("Both", title="Trade Direction", options=["Long", "Short", "Both"], tooltip="Choose whether to trade only Long, only Short, or Both directions.")
confirm_candles = input(2, title="Number of Confirming Candles", tooltip="The number of consecutive candles that must meet the conditions before entering a trade.")

// === Indicator Calculations ===
basis = ta.sma(close, length)
dev = mult * ta.stdev(close, length)
upper_band = basis + dev
lower_band = basis - dev
rsi_val = ta.rsi(close, rsi_length)
atr_val = ta.atr(14)
vol_filter = volume > ta.sma(volume, 20)
ema_trend = ta.ema(close, trend_filter_length)

// === Helper Function for Confirmation ===
confirm_condition(cond, lookback) =>
    count = 0
    for i = 0 to lookback - 1
        count += cond[i] ? 1 : 0
    count == lookback

// === Trend Filter ===
trend_is_bullish = close > ema_trend
trend_is_bearish = close < ema_trend

// === Long and Short Conditions with Confirmation ===
long_raw_condition = close > upper_band * 1.01 and rsi_val > rsi_midline and (not volume_filter or vol_filter) and trend_is_bullish
short_raw_condition = close < lower_band * 0.99 and rsi_val < rsi_midline and (not volume_filter or vol_filter) and trend_is_bearish

long_condition = confirm_condition(long_raw_condition, confirm_candles)
short_condition = confirm_condition(short_raw_condition, confirm_candles)

// === Trade Entry and Exit Logic ===
if long_condition and (trade_direction == "Long" or trade_direction == "Both")
    strategy.entry("Long", strategy.long)
    strategy.exit("Exit Long", "Long", stop=close - (atr_multiplier * atr_val), limit=close + (atr_multiplier * risk_reward_ratio * atr_val))

if short_condition and (trade_direction == "Short" or trade_direction == "Both")
    strategy.entry("Short", strategy.short)
    strategy.exit("Exit Short", "Short", stop=close + (atr_multiplier * atr_val), limit=close - (atr_multiplier * risk_reward_ratio * atr_val))

// === Plotting ===
plot(upper_band, color=color.green, title="Upper Band")
plot(lower_band, color=color.red, title="Lower Band")
plot(basis, color=color.blue, title="Basis")
plot(ema_trend, color=color.orange, title="Trend Filter EMA")