マルチインジケータートレンドフォローとボラティリティブレイクアウト戦略

EMA ADX ATR OBV RSI
作成日: 2024-12-12 15:48:29 最終変更日: 2024-12-12 15:48:29
コピー: 2 クリック数: 431
1
フォロー
1617
フォロワー

マルチインジケータートレンドフォローとボラティリティブレイクアウト戦略

概要

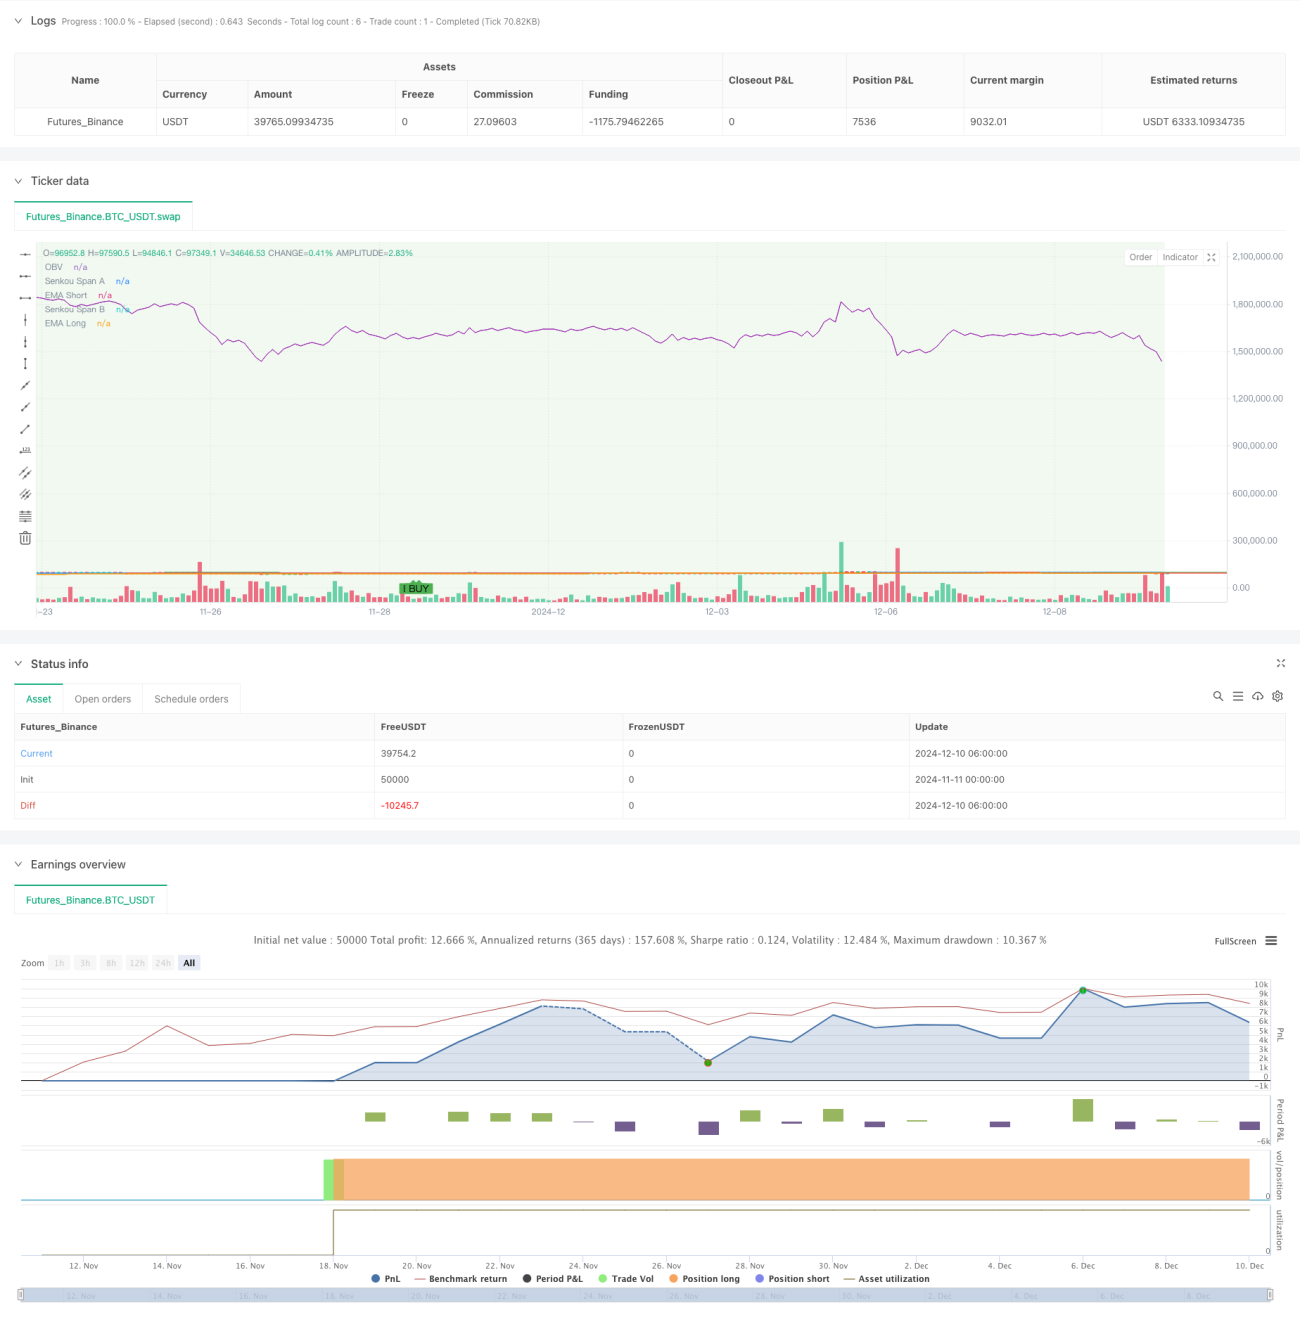
これは,複数の技術指標のトレンド追跡と波動ブレイク戦略を組み合わせた戦略である.この戦略は,均線システム (EMA),トレンド強度指標 (ADX),市場波動指標 (ATR),価格分析 (OBV) を統合し,イチモク雲図やランダムな指標 (Stochastic) などの補助指標を用い,市場トレンドとブレイクチャンスを捉える.この戦略は,取引効率を向上させるために,厳格な時間フィルターを設定し,特定の取引時間内にのみ動作する.

戦略原則

戦略の核心的な論理は,複数の技術指標の総合的な判断に基づいています.

  1. 50サイクルと200サイクルEMAを使用してトレンド追跡システムを構築
  2. ADX指標によるトレンドの強さ確認
  3. イチモク雲の地図を利用して,トレンド確認を追加します.
  4. ストキャスティック指標と組み合わせた超買いと超売り領域の識別
  5. ATRでダイナミックに設定するストップ・ロズとトーネス・ターゲット
  6. OBVによる取引量支持度検証

策略は以下の条件を満たす場合に買入シグナルを発信します.

  • 取引が許可された期間中です
  • 価格が短期EMAより上にある
  • 短期EMAは長期EMAの上にあります.
  • ADX は設定された値より高い
  • 価格が雲の上のグラフにある
  • ストキャスティック指数は超売り状態

戦略的優位性

  1. 多層技術指標のクロス検証により,信号の信頼性が向上
  2. トレンド追跡と波動ブレイクを組み合わせ,戦略の適応性を高める
  3. 時間のフィルターで低効率な取引を避ける
  4. 市場変動に適応するダイナミックなストップ・ロスと利益目標設定
  5. 価格と分析の組み合わせにより,より包括的な市場視点を提供します.
  6. システム化された出場規則,主観的な判断を減らす

戦略リスク

  1. 多指数システムは信号の遅延を引き起こす可能性があります.
  2. 横盤市場では偽信号が多く発生する可能性がある.
  3. パラメータ最適化は困難で,過度最適化のリスクが高い.
  4. 取引時間制限で重要なことが失われる可能性
  5. ストップオフの設定が大きすぎると,単一損失が高くなる可能性があります.

リスク管理の提案:

  • パラメータの設定を定期的にチェックして最適化
  • 波動率のフィルターを追加する
  • 資金管理の厳格な規則を導入する
  • トレンド確認の補助指標を増加させる

戦略最適化の方向性

  1. 市場状況に応じて動的に指標パラメータを調整する適応パラメータシステムを導入
  2. 市場状況の分類機構を追加し,異なる市場環境で異なるシグナル生成ルールを使用する
  3. タイムフィルター設定を最適化し,過去データに基づいて最適取引時間を分析します.
  4. ストップ・ストップ戦略の改善,ストップ・ストップの追跡を考える
  5. 市場情緒指数に追加して信号の質を向上させる

要約する

この戦略は,複数の技術指標を総合的に使用することによって,完全な取引システムを構築している.戦略の優点は,複数の指標のクロス検証と厳格なリスク管理にあるが,パラメータ最適化や信号遅滞などの課題にも直面している.継続的な最適化と改善により,戦略は,異なる市場環境で安定したパフォーマンスを維持する見込みである.

ストラテジーソースコード
/*backtest
start: 2024-11-11 00:00:00
end: 2024-12-10 08:00:00
period: 2h
basePeriod: 2h
exchanges: [{"eid":"Futures_Binance","currency":"BTC_USDT"}]
*/

//@version=5
strategy("Khaleq Strategy Pro - Fixed Version", overlay=true)

// === Input Settings ===
ema_short = input.int(50, "EMA Short", minval=1)
ema_long = input.int(200, "EMA Long", minval=1)
adx_threshold = input.int(25, "ADX Threshold", minval=1)
atr_multiplier = input.float(2.0, "ATR Multiplier", minval=0.1)
time_filter_start = input(timestamp("0000-01-01 09:00:00"), "Trading Start Time", group="Time Filter")
time_filter_end = input(timestamp("0000-01-01 17:00:00"), "Trading End Time", group="Time Filter")

// === Ichimoku Settings ===
tenkan_len = 9
kijun_len = 26
senkou_span_b_len = 52
displacement = 26

// === Calculations ===
// Ichimoku Components
tenkan_sen = (ta.highest(high, tenkan_len) + ta.lowest(low, tenkan_len)) / 2
kijun_sen = (ta.highest(high, kijun_len) + ta.lowest(low, kijun_len)) / 2
senkou_span_a = (tenkan_sen + kijun_sen) / 2
senkou_span_b = (ta.highest(high, senkou_span_b_len) + ta.lowest(low, senkou_span_b_len)) / 2

// EMA Calculations
ema_short_val = ta.ema(close, ema_short)
ema_long_val = ta.ema(close, ema_long)

// Manual ADX Calculation
length = 14
dm_plus = math.max(ta.change(high), 0)
dm_minus = math.max(-ta.change(low), 0)
tr = math.max(high - low, math.max(math.abs(high - close[1]), math.abs(low - close[1])))
tr14 = ta.sma(tr, length)
dm_plus14 = ta.sma(dm_plus, length)
dm_minus14 = ta.sma(dm_minus, length)
di_plus = (dm_plus14 / tr14) * 100
di_minus = (dm_minus14 / tr14) * 100
dx = math.abs(di_plus - di_minus) / (di_plus + di_minus) * 100
adx_val = ta.sma(dx, length)

// ATR Calculation
atr_val = ta.atr(14)

// Stochastic RSI Calculation
k = ta.stoch(close, high, low, 14)
d = ta.sma(k, 3)

// Time Filter
is_within_time = true

// Support and Resistance (High and Low Levels)
resistance_level = ta.highest(high, 20)
support_level = ta.lowest(low, 20)

// Volume Analysis (On-Balance Volume)
vol_change = ta.change(close)
obv = ta.cum(vol_change > 0 ? volume : vol_change < 0 ? -volume : 0)

// === Signal Conditions ===
buy_signal = is_within_time and
             (close > ema_short_val) and
             (ema_short_val > ema_long_val) and
             (adx_val > adx_threshold) and
             (close > senkou_span_a) and
             (k < 20)  // Stochastic oversold

sell_signal = is_within_time and
              (close < ema_short_val) and
              (ema_short_val < ema_long_val) and
              (adx_val > adx_threshold) and
              (close < senkou_span_b) and
              (k > 80)  // Stochastic overbought

// === Plotting ===
// Plot Buy and Sell Signals
plotshape(buy_signal, color=color.green, style=shape.labelup, title="Buy Signal", location=location.belowbar, text="BUY")
plotshape(sell_signal, color=color.red, style=shape.labeldown, title="Sell Signal", location=location.abovebar, text="SELL")

// Plot EMAs
plot(ema_short_val, color=color.blue, title="EMA Short")
plot(ema_long_val, color=color.orange, title="EMA Long")

// Plot Ichimoku Components
plot(senkou_span_a, color=color.green, title="Senkou Span A", offset=displacement)
plot(senkou_span_b, color=color.red, title="Senkou Span B", offset=displacement)

// // Plot Support and Resistance using lines
// var line resistance_line = na
// var line support_line = na
// if bar_index > 1
//     line.delete(resistance_line)
//     line.delete(support_line)
// resistance_line := line.new(x1=bar_index - 1, y1=resistance_level, x2=bar_index, y2=resistance_level, color=color.red, width=1, style=line.style_dotted)
// support_line := line.new(x1=bar_index - 1, y1=support_level, x2=bar_index, y2=support_level, color=color.green, width=1, style=line.style_dotted)

// Plot OBV
plot(obv, color=color.purple, title="OBV")

// Plot Background for Trend (Bullish/Bearish)
bgcolor(close > ema_long_val ? color.new(color.green, 90) : color.new(color.red, 90), title="Trend Background")

// === Alerts ===
alertcondition(buy_signal, title="Buy Alert", message="Buy Signal Triggered")
alertcondition(sell_signal, title="Sell Alert", message="Sell Signal Triggered")

// === Strategy Execution ===
if buy_signal
    strategy.entry("Buy", strategy.long)

if sell_signal
    strategy.close("Buy")
    strategy.exit("Sell", "Buy", stop=close - atr_multiplier * atr_val, limit=close + atr_multiplier * atr_val)