トレンドフォロー型クラウドチャートモメンタムダイバージェンス戦略

1
Follow
1781
Followers
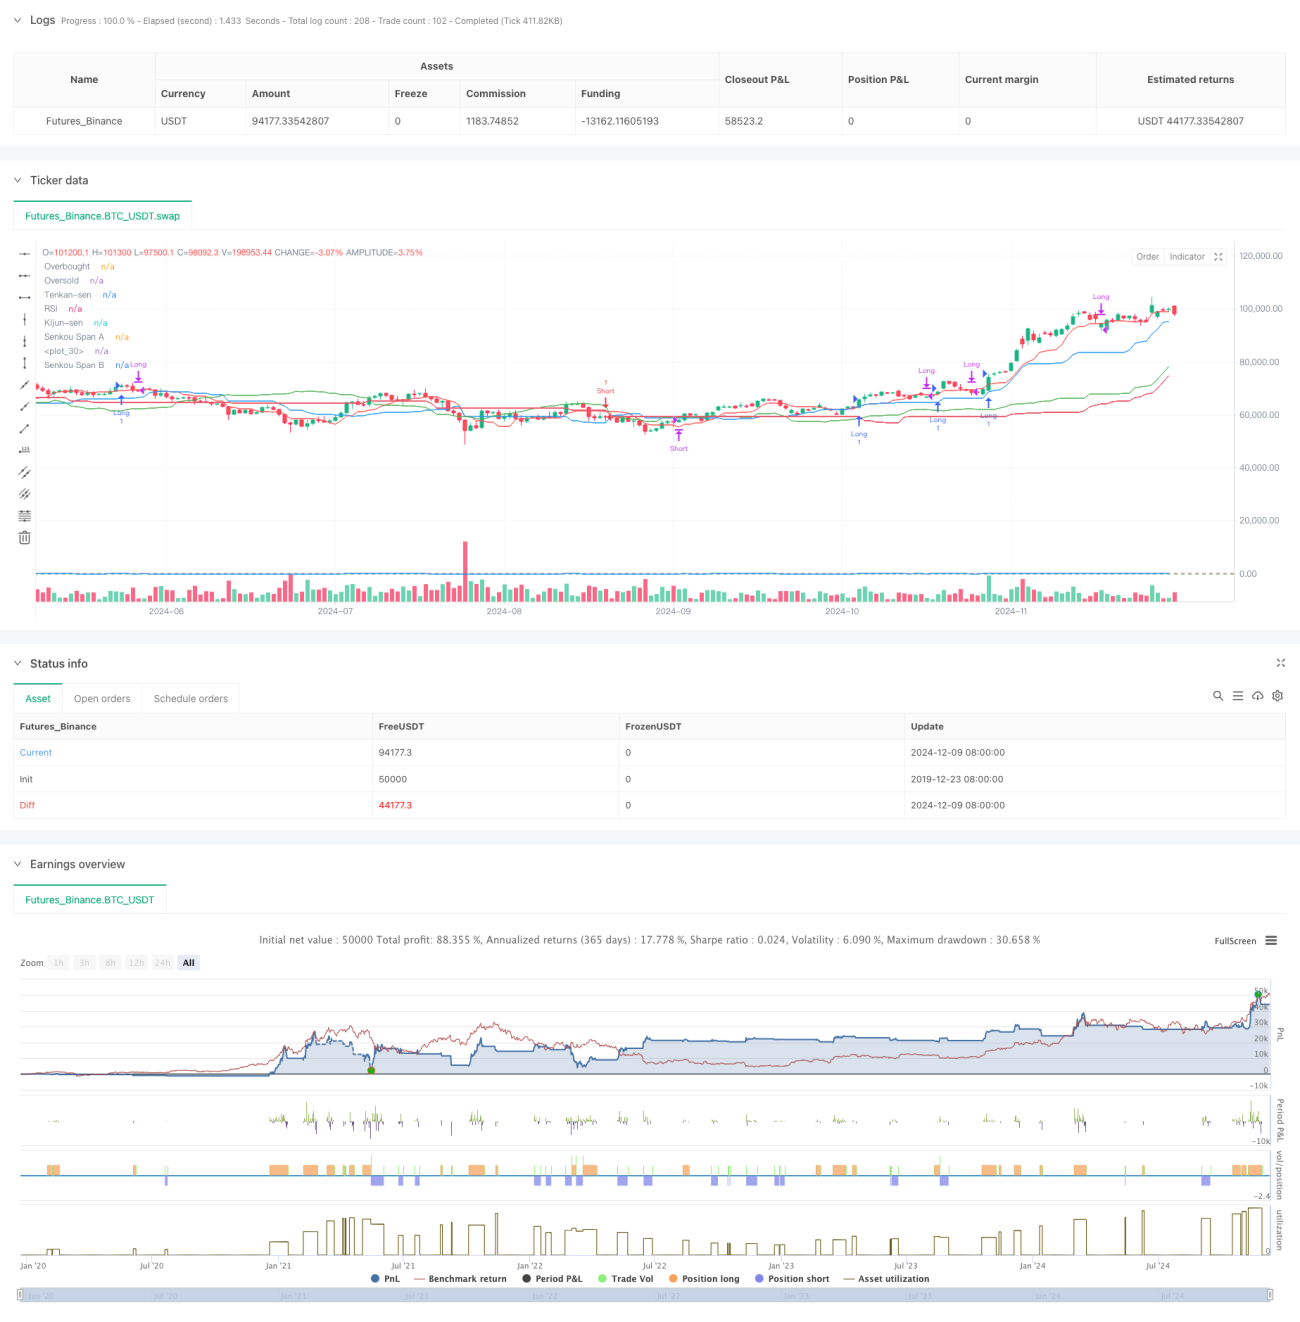
概要
この戦略は,一目で均衡図 ((Ichimoku Cloud),比較的強い指標 ((RSI) と移動平均の収束散乱指標 ((MACD) を融合した総合的なトレンド追跡取引システムである.この戦略は,クラウドグラフで全体的なトレンドの方向性を判断し,RSIを使用して価格の動きを確認し,MACD信号線の交差と組み合わせて特定の取引タイミングを決定し,多層の市場分析と取引意思決定を実現する.
戦略原則
戦略の核心的な論理は,以下の3つの技術指標の協調的な配合に基づいています.
- 一目平衡図は,価格が雲層の上にあるときの多頭傾向を識別し,雲層の下にあるときの空頭傾向を識別するために,トレンド環境を決定するために使用される.
- RSIは,極端な動きをフィルターするために使用され,余剰時RSIが30 (超売れない) よりも高く,空白時RSIが70 (超売れない) よりも低くなることを要求します.
- MACD信号線交差は,具体的入場と出場のトリガー条件として,MACD線上の信号線を穿越すると入場を多行し,下穿越すると入場を空行する.
戦略の取引ルールは以下の通りです.
複数の条件がある:
- 価格が雲の上にある
- RSIは30より大きい
- MACD線は,信号線を横切っている.
公開条件:
- 価格が雲の下にある
- RSIは70未満です.
- MACDは,線下から信号線を通過します.
戦略的優位性
- 多重確認メカニズム: 偽信号の影響を3つの独立した指標を統合することで軽減します.
- トレンドフォロー性強:一目瞭然のバランスグラフの使用は,戦略が明確なトレンドの中で動作することを保証する.
- リスクコントロールの改善:RSIのフィルタリング効果により,過剰な買い過ぎと売り過ぎのゾーンへの入場を避ける.
- シグナル明瞭:MACD交差点は,入場出場シグナルを明確に提供している.
- 適応性:戦略は,異なる市場環境と取引品種に適用できます.
戦略リスク
-
トレンド反転リスク: トレンドの転換点において継続的なストップロスが発生する可能性があります。
推薦:トレンド確認の時間周期の要求を追加できます. -
波動市場リスク:区間波動市場では頻繁に取引が起こり得る.
推奨: 要求された最小波動幅の信号フィルタリング条件を追加する. -
遅滞のリスク:指標は遅滞し,最適な入場点を逃す可能性があります.
提案:より迅速な指標や価格行動分析と組み合わせることができます. -
パラメータの感受性: パラメータの設定を間違えた場合,策略がうまく機能しない可能性があります.
推奨: 適切なパラメータの組み合わせを決定するために,反省の最適化が必要です.
戦略最適化の方向性
- 動態パラメータの調整:
- 市場変動に合わせて自動的に Cloud Graph パラメータを調整する
- 市場環境の動向に基づいてRSIの値下げ調整
- MACDパラメータの自在な最適化
- 市場環境フィルターを追加します:
- 低波動期をフィルタリングする波動率指数を追加
- 交付確認メカニズムを導入
- 市場サイクルに関する情報を考慮する
- リスク管理の改善:
- ダイナミック・ストップ・ローズ・ストラテジー
- ポジション管理システムへの加入
- より柔軟な退出の仕組みを設計する
要約する
この戦略は,一目的な均衡図,RSIとMACDの3つのクラシックな技術指標を組み合わせて,完全なトレンド追跡取引システムを構築する.この戦略の主要な優点は,複数の確認機構と明確な取引ルールにあるが,同時に,トレンドの転換点と振動市場がもたらすリスクにも注意する必要がある.ダイナミックなパラメータ調整,市場環境のフィルタリング,リスク管理の最適化により,戦略の安定性と収益性がさらに向上する見込みがある.
Source
Pine
Related strategies
Comment
All comments (0)
No data
- 1