1
フォロー
1750
フォロワー
概要
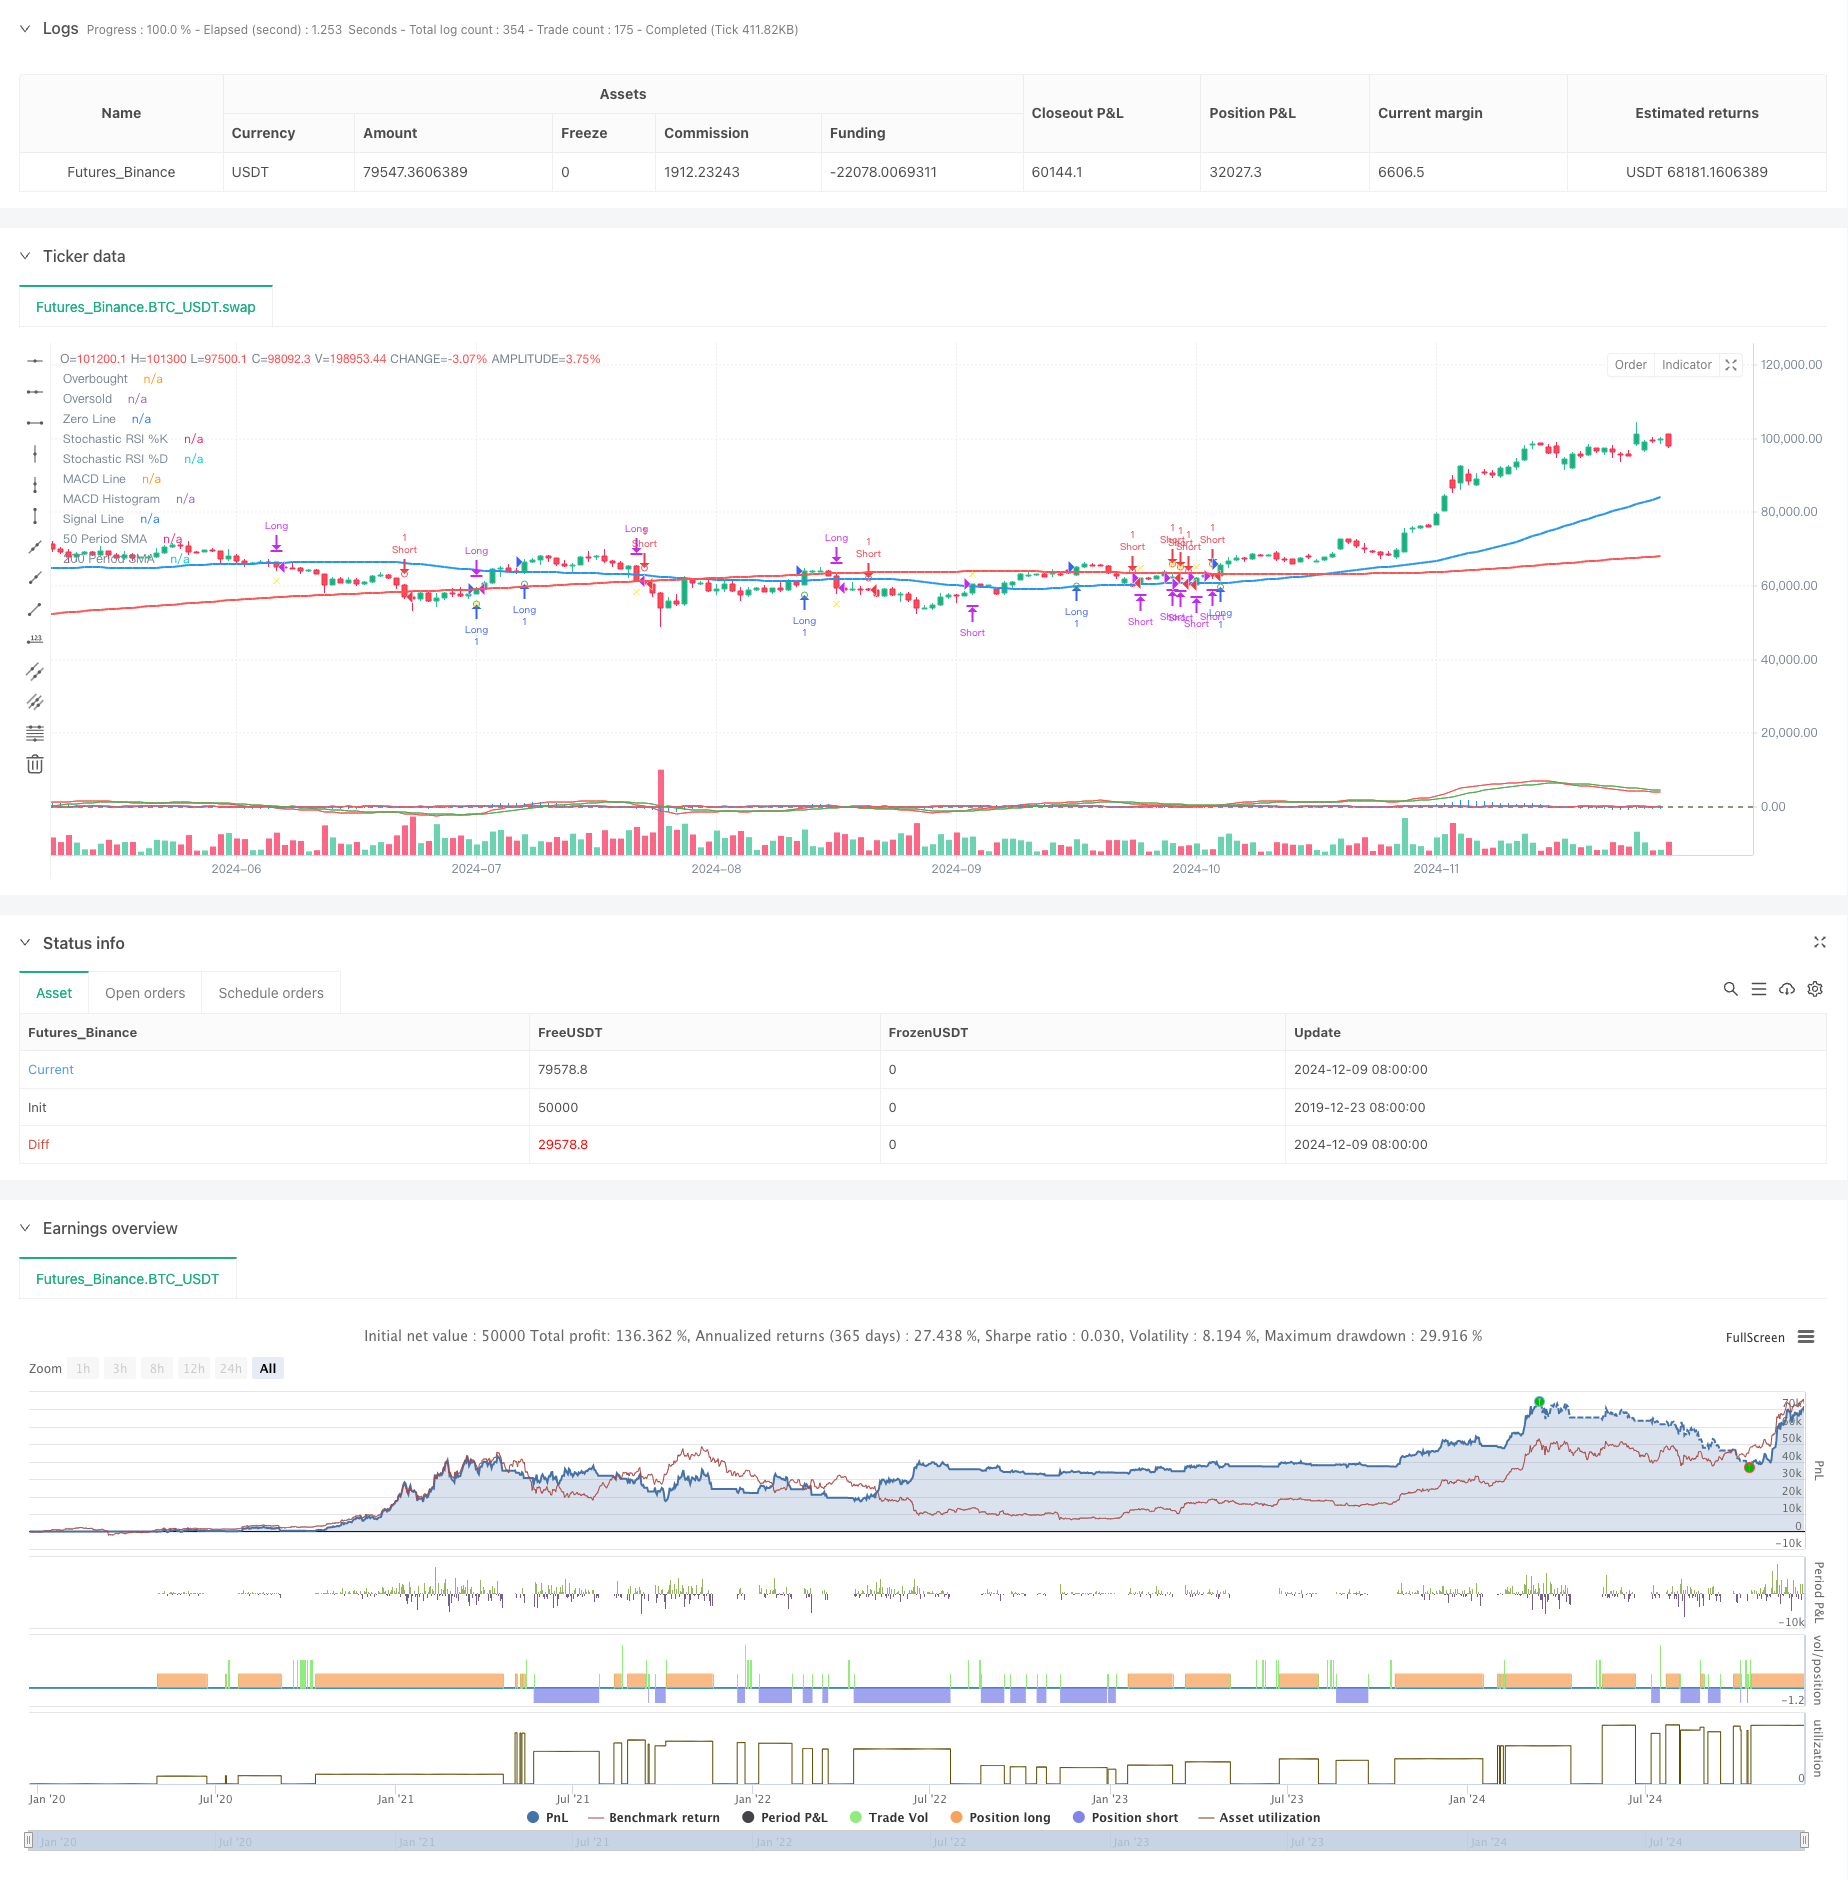
この戦略は,RSI,MACD,移動平均 ((SMA) など,複数の技術指標を組み合わせた複雑な多指標取引システムであり,価格の傾向と運動を分析することによって取引機会を識別する.この戦略は,200日平均線を長期トレンドとして使用し,50日平均線を中期トレンドとして参照し,ランダムなRSIとMACDの交差信号を使用して取引時間を確認する.
戦略原則
戦略の中核となるロジックは、次の 3 つの主要な柱に基づいています。
- トレンド判断: 200日平均線を用いて主要トレンドの方向を判断する.平均線上は上昇傾向,下は下降傾向である.
- 動力の確認:ランダムなRSI指標 ((SRSI)) の%K線と%D線を交差して価格動力を確認し,%K線が%D線を交差すると上昇動力が強化される.
- トレンド確認:トレンド確認のツールとしてMACD指標を使用し,MACD線は信号線の上部で上昇傾向を確認する.
購入条件は同時に満たされている必要があります:
- 価格が200日平均線上にある
- ランダムなRSIの%Kラインに%Dラインを穿え
- MACD線は信号線の上にあります.
販売条件は以下の通りです.
- 価格が200日平均線以下で
- ランダムなRSIの%K線が%D線を横切る
- MACD線はシグナル線の下にある.
戦略的優位性
- 多重検証:複数の技術指標の組み合わせにより,偽信号のリスクを低減する.
- トレンド追跡:長期平均線と中期平均線を組み合わせて,主要トレンドを効果的に把握する.
- 動態認識:ランダムなRSIを使用することで,潜在的なトレンドの転換点をより早く発見できます.
- リスク管理: 50日平均線をストップ・レファレンスとして使用し,明確な退出メカニズムを提供します.
- システム化された操作: 策略の論理が明確で,プログラム的に実装し,反省検証が容易である.
戦略リスク
- 遅滞リスク:移動平均は本質的に遅滞指標であり,入場と出場のタイミングの遅延を引き起こす可能性がある.
- 横軸の振動市場では,複数の指標が混沌の信号を生じさせる可能性があります.
- 偽の突破リスク: 短期間の平均線突破の後に価格が急速に下がり,偽のシグナルが発生する可能性がある.
- パラメータ感性:複数の指標のパラメータ設定は,異なる市場環境のために最適化する必要があります.
- 信号の衝突: 異なる指標によって,矛盾する信号が生み出され,意思決定の難しさが増加する.
戦略最適化の方向性
評価のパラメータの最適化
- 過去のデータから,最適な移動平均の周期を見つけることができます.
- ランダムなRSIのパラメータを最適化して,異なる市場の変動に適応する
信号のフィルター:
- ボリューム確認メカニズムを追加
- 波動性指標を導入し,波動性の高い期間に取引戦略を調整する
リスク管理の改善:
- 動的ストップロスメカニズムの実装
- 市場変動によるポジションサイズ調整
市場の適応性:
- 市場環境識別メカニズムの追加
- 異なる市場条件で異なるパラメータ設定を使用する
要約する
これは,複数の技術指標の配合使用によって,取引の信頼性を保証しながら,明確なリスク制御機構を提供している,体系化されたトレンド追跡戦略である.戦略の主な優点は,その多層の検証機構にあるが,同時に,複数の指標がもたらす可能性のある遅れのリスクを制御する注意が必要である.継続的な最適化と改善によって,この戦略は,異なる市場環境で安定したパフォーマンスを維持する見込みである.
ストラテジーソースコード
/*backtest
start: 2019-12-23 08:00:00
end: 2024-12-10 08:00:00
period: 1d
basePeriod: 1d
exchanges: [{"eid":"Futures_Binance","currency":"BTC_USDT"}]
*/

//@version=5
strategy("RSI and MACD by Karthik", overlay=true)

// Define periods for SMAs
sma50Period = 50
sma200Period = 200

// Calculate SMAs
sma50 = ta.sma(close, sma50Period)
sma200 = ta.sma(close, sma200Period)

// Plot SMAs on the main chart
plot(sma50, color=color.blue, title="50 Period SMA", linewidth=2)
plot(sma200, color=color.red, title="200 Period SMA", linewidth=2)

// Define and calculate parameters for Stochastic RSI
stochRSIPeriod = 14
rsi = ta.rsi(close, stochRSIPeriod)
stochRSIK = ta.stoch(rsi, rsi, stochRSIPeriod, 3)
stochRSID = ta.sma(stochRSIK, 3)

// Define and calculate parameters for MACD
macdShort = 12
macdLong = 26
macdSignal = 9
[macdLine, signalLine, macdHist] = ta.macd(close, macdShort, macdLong, macdSignal)

// Plot Stochastic RSI in a separate pane
hline(80, "Overbought", color=color.red, linewidth=1)
hline(20, "Oversold", color=color.green, linewidth=1)
plot(stochRSIK, color=color.blue, title="Stochastic RSI %K")
plot(stochRSID, color=color.red, title="Stochastic RSI %D")

// Plot MACD in a separate pane
hline(0, "Zero Line", color=color.gray, linewidth=1)
plot(macdHist, color=color.blue, title="MACD Histogram", style=plot.style_histogram)
plot(macdLine, color=color.red, title="MACD Line")
plot(signalLine, color=color.green, title="Signal Line")

// Conditions for buy and sell signals
isAbove200SMA = close > sma200
isStochRSIKAbove = stochRSIK > stochRSID
macdLineAbove = macdLine > signalLine
buySignal = isAbove200SMA and isStochRSIKAbove and macdLineAbove

isBelow200SMA = close < sma200
isStochRSIKBelow = stochRSIK < stochRSID
macdLineBelow = macdLine < signalLine
sellSignal = isBelow200SMA and isStochRSIKBelow and macdLineBelow

// Track the last signal with explicit type declaration
var string lastSignal = na

// Create series for plotting conditions
var bool plotBuySignal = na
var bool plotSellSignal = na
var bool plotExitBuySignal = na
var bool plotExitSellSignal = na

// Update plotting conditions based on signal and last signal
if buySignal and (lastSignal != "buy")
    plotBuySignal := true
    lastSignal := "buy"
else
    plotBuySignal := na

if sellSignal and (lastSignal != "sell")
    plotSellSignal := true
    lastSignal := "sell"
else
    plotSellSignal := na

// Update exit conditions based on SMA50
if lastSignal == "buy" and close < sma50
    plotExitBuySignal := true
    lastSignal := na // Clear lastSignal after exit
else
    plotExitBuySignal := na

if lastSignal == "sell" and close > sma50
    plotExitSellSignal := true
    lastSignal := na // Clear lastSignal after exit
else
    plotExitSellSignal := na

// Plot buy and sell signals on the main chart
plotshape(series=plotBuySignal, location=location.belowbar, color=color.green, style=shape.circle, size=size.small, title="Buy Signal")
plotshape(series=plotSellSignal, location=location.abovebar, color=color.red, style=shape.circle, size=size.small, title="Sell Signal")

// Plot exit signals for buy and sell
plotshape(series=plotExitBuySignal, location=location.belowbar, color=color.yellow, style=shape.xcross, size=size.small, title="Exit Buy Signal")
plotshape(series=plotExitSellSignal, location=location.abovebar, color=color.yellow, style=shape.xcross, size=size.small, title="Exit Sell Signal")


// Strategy to Backtest

long = buySignal
short = sellSignal

// Exit Conditions
exitBuy = close < sma50
exitSell = close > sma50


if (buySignal)
    strategy.entry("Long", strategy.long, 1.0)
if (sellSignal)
    strategy.entry("Short", strategy.short, 1.0)

strategy.close("Long", when=exitBuy)
strategy.close("Short", when=exitSell)