
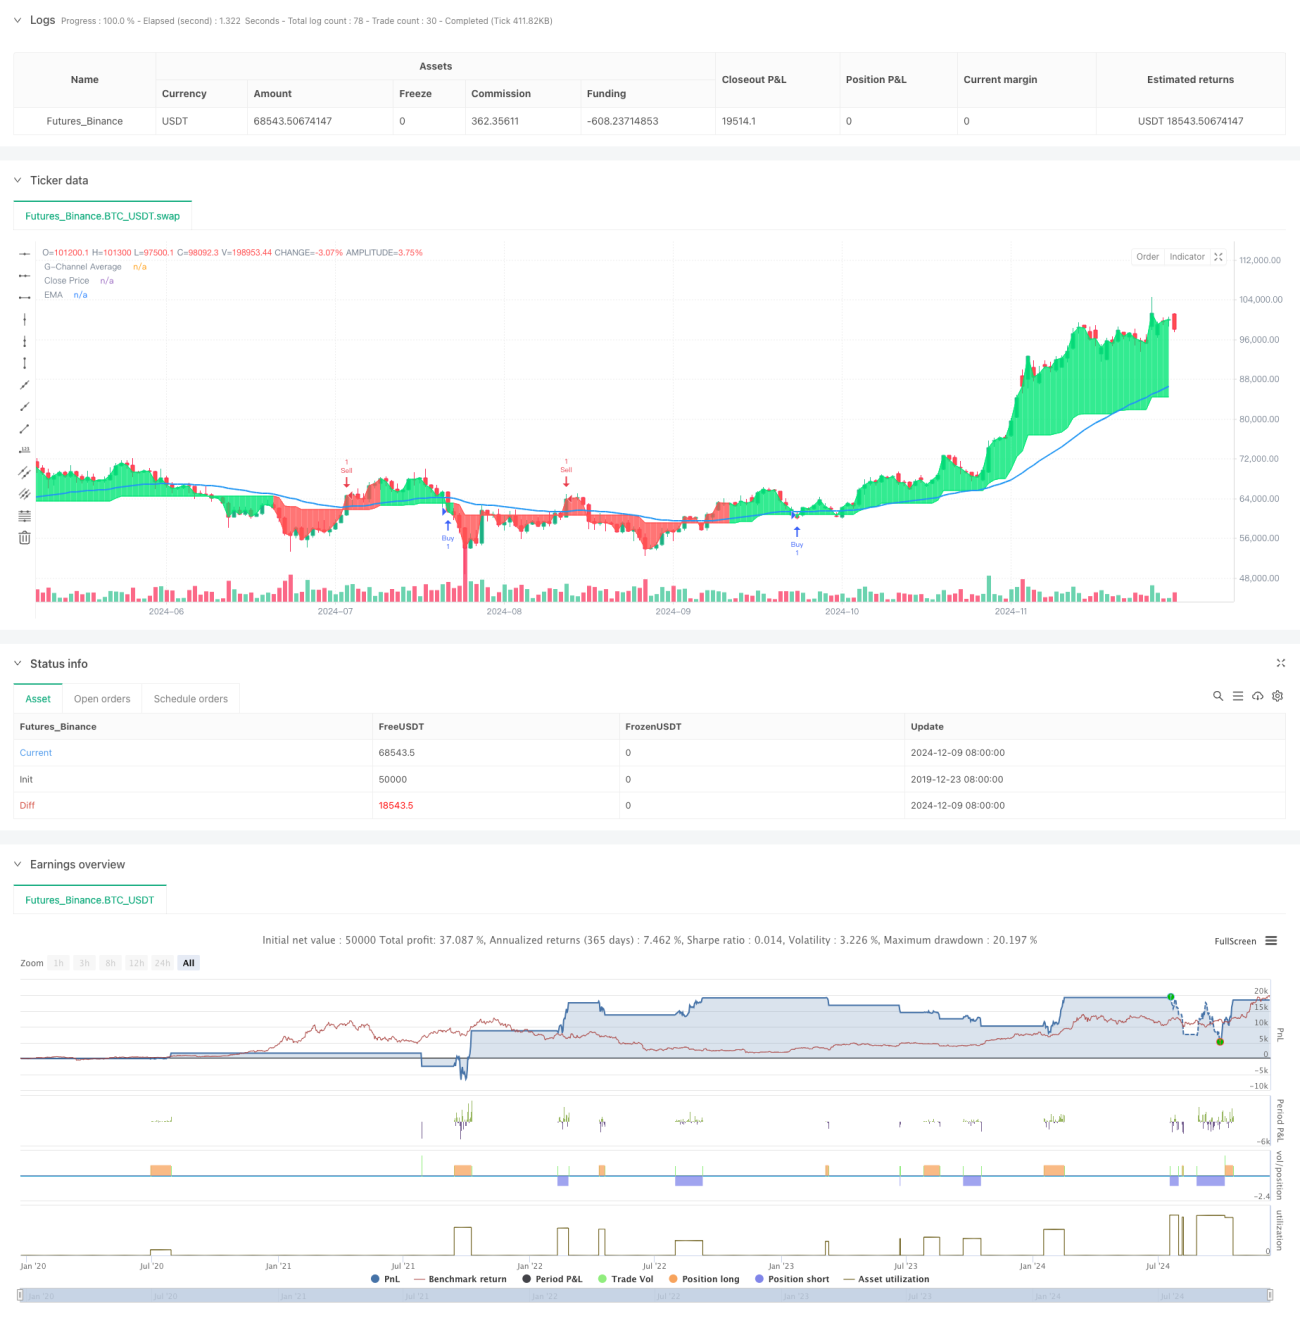
この戦略は,Gチャネル (G-Channel),インデックス移動平均 (EMA) と実際の波動幅 (ATR) を組み合わせた多指標取引システムである.それは,動的サポート/抵抗値とトレンド確認によって取引信号を識別し,ATRベースのストップとストップを使用してリスクを管理する.システムは,信頼性とリスク管理に重点を置くように設計されており,安定した取引方法を求めるトレーダーに適しています.
戦略の核心的な論理は,以下の重要な要素に基づいています.
この戦略は,複数の成熟した技術指標を組み合わせて,完全な取引システムを構築している.システムの優位性は,多層の信号確認機構と変動率に基づくリスク管理にあるが,実際のアプリケーションでは,特定の市場の特徴に応じて最適化が必要である.提案された最適化方向によって,戦略の安定性と適応性をさらに向上させることができる.
/*backtest
start: 2019-12-23 08:00:00
end: 2024-12-10 08:00:00
period: 1d
basePeriod: 1d
exchanges: [{"eid":"Futures_Binance","currency":"BTC_USDT"}]
*/
//@version=5
strategy("G-Channel with EMA Strategy and ATR SL/TP", shorttitle="G-EMA-ATR", overlay=true)
// Input parameters
length = input.int(100, title="G-Channel Length")
src = input.source(close, title="Source")
ema_length = input.int(50, title="EMA Length") // EMA length
atr_length = input.int(14, title="ATR Length") // ATR length
// G-Channel calculation
var float a = na
var float b = na
a := math.max(src, nz(a[1])) - nz(a[1] - b[1]) / length
b := math.min(src, nz(b[1])) + nz(a[1] - b[1]) / length
avg = (a + b) / 2
// G-Channel cross conditions
crossup = b[1] < close[1] and b > close
crossdn = a[1] < close[1] and a > close
bullish = ta.barssince(crossdn) <= ta.barssince(crossup)
c = bullish ? color.lime : color.red
// EMA calculation
ema_value = ta.ema(src, ema_length)
// ATR calculation
atr_value = ta.atr(atr_length)
// Plot G-Channel average and Close price
p1 = plot(avg, "G-Channel Average", color=c, linewidth=1, transp=90)
p2 = plot(close, "Close Price", color=c, linewidth=1, transp=100)
fill(p1, p2, color=c, transp=90)
// Plot EMA
plot(ema_value, color=color.blue, linewidth=2, title="EMA")
// Buy and Sell conditions
buy_condition = bullish and close < ema_value
sell_condition = not bullish and close > ema_value
// Track the last signal state
var bool last_was_buy = false
var bool last_was_sell = false
// ATR-based SL and TP calculations
long_sl = close - 2 * atr_value // 2 ATR below the entry for SL
long_tp = close + 4 * atr_value // 4 ATR above the entry for TP
short_sl = close + 2 * atr_value // 2 ATR above the entry for SL (short)
short_tp = close - 4 * atr_value // 4 ATR below the entry for TP (short)
// Generate Buy signal only if the last signal was not Buy
if (buy_condition and not last_was_buy)
strategy.entry("Buy", strategy.long)
strategy.exit("Exit Buy", from_entry="Buy", stop=long_sl, limit=long_tp)
last_was_buy := true
last_was_sell := false
// Generate Sell signal only if the last signal was not Sell
if (sell_condition and not last_was_sell)
strategy.entry("Sell", strategy.short)
strategy.exit("Exit Sell", from_entry="Sell", stop=short_sl, limit=short_tp)
last_was_sell := true
last_was_buy := false
// Plot shapes for Buy and Sell signals
plotshape(series=buy_condition and not last_was_buy, location=location.belowbar, style=shape.labelup, color=color.lime, size=size.small, text="Buy", textcolor=color.white)
plotshape(series=sell_condition and not last_was_sell, location=location.abovebar, style=shape.labeldown, color=color.red, size=size.small, text="Sell", textcolor=color.white)