ATRに基づくダイナミックトレーリングストップロス取引戦略

ATR EMA TS
作成日: 2024-12-12 16:18:19 最終変更日: 2024-12-12 16:18:19
コピー: 0 クリック数: 384
1
フォロー
1617
フォロワー

ATRに基づくダイナミックトレーリングストップロス取引戦略

概要

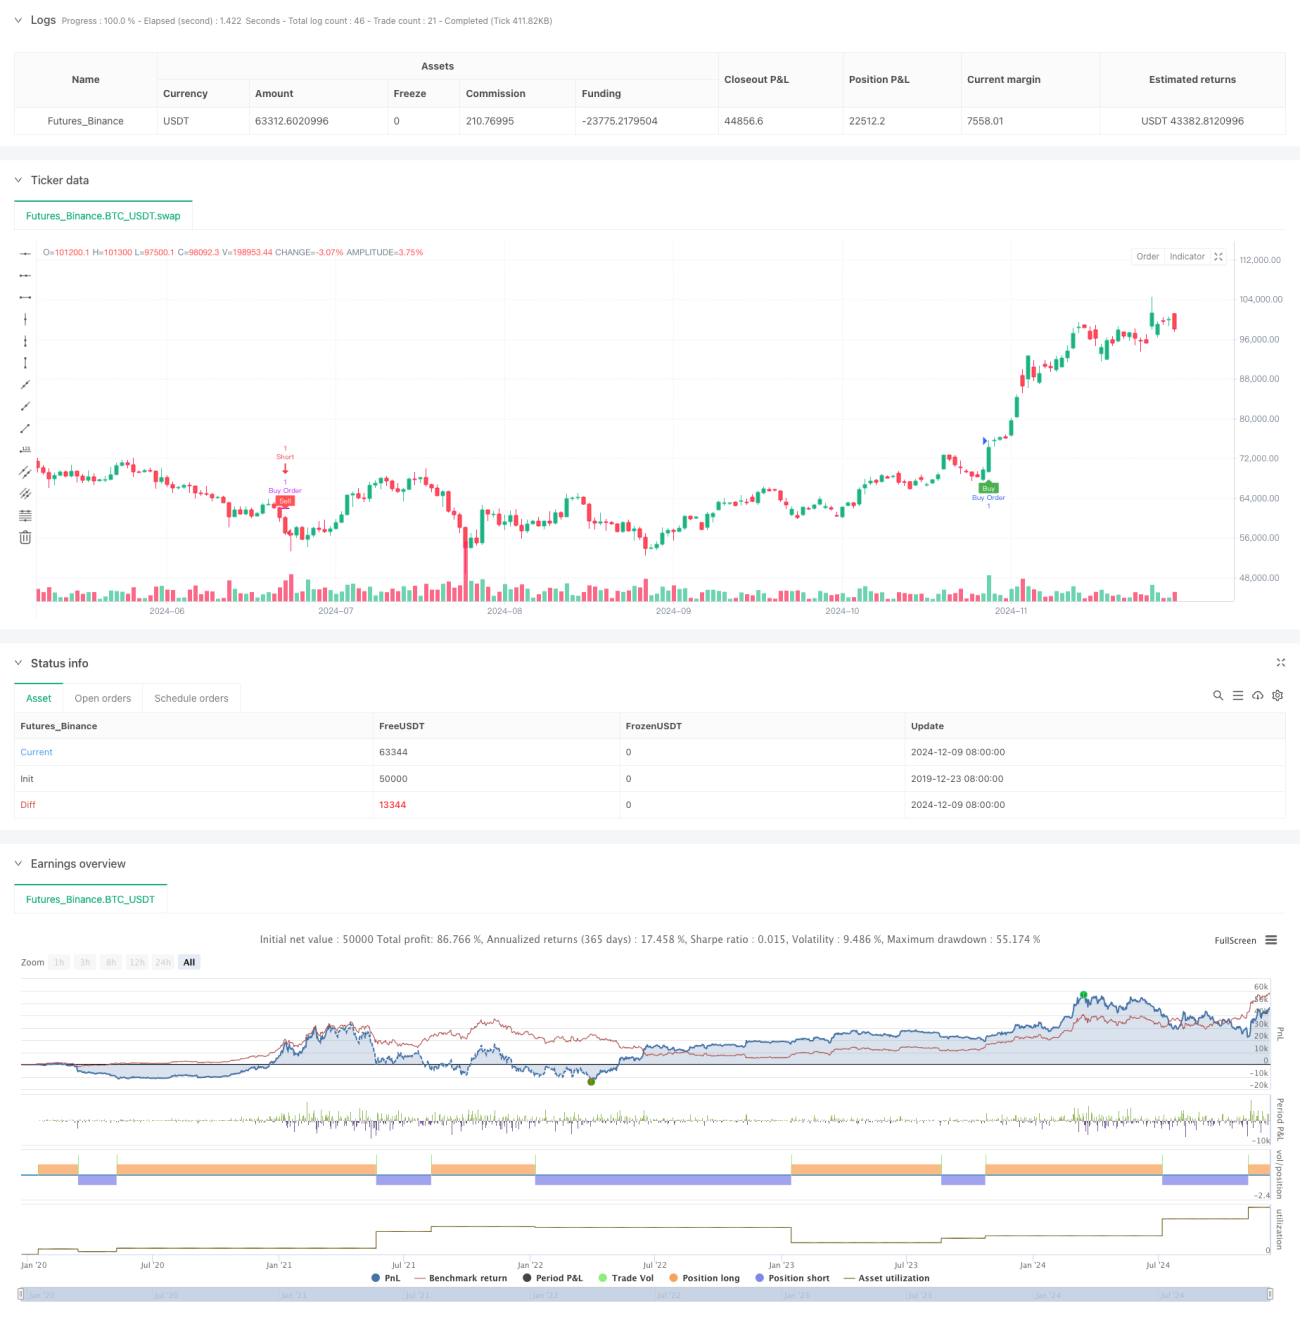
この戦略はATR (平均リアル波幅) 指標に基づくダイナミック・トラッキング・ストップ・ストラトジーである.ATRの値によってストップ・ポジションを動的に調整し,EMA均線と組み合わせて取引信号の確認を行う.戦略は,柔軟なポジション管理をサポートし,異なる市場環境と取引品種に応じてカスタマイズされた買取り数量を行うことができる.これは,5分から2時間といった中期的な時間周期で動作するのに特に適しており,市場動向を効果的に捉える.

戦略原則

戦略の中核となるロジックは、次の主要な要素に基づいています。

  1. ATR指数を使用して市場の変動率を計算し,ユーザのカスタマイズされた係数でストップ距離を調整する
  2. 価格の変動に合わせて自動的に調整されるストップラインを動的に追跡する
  3. EMA平均線とストップラインの交差点を用いて取引シグナルを確認する
  4. 価格がストップラインを突破し,EMAが確認したときに取引シグナルを生成する
  5. ポジション管理システムによる取引数の管理と,ポートフォリオの状態をリアルタイムで追跡

戦略的優位性

  1. 適応性 - ATR指標は,市場の波動に応じて自動的にストップ距離を調整することができ,異なる市場環境で戦略が良好なパフォーマンスを維持できます.
  2. 優れたリスク管理 - ダイナミック・トラッキング・ストップ・メカニズムにより,既得利益を効果的に保護し,潜在的損失を制限できます
  3. 操作の柔軟性 - 異なる取引品種特性に合わせて最適化できるカスタム取引数とATRパラメータをサポート
  4. 信号信頼性 - EMAによる均線確認,偽信号の影響を減らす
  5. 全自動化 - 戦略は完全に自動化され,感情的な干渉を減らすことができます.

戦略リスク

  1. 振動市場リスク - 横盤振動市場では,頻繁に偽ブレイクシグナルが生み出され,過度の取引が起こる可能性があります.
  2. スライドポイントリスク - 戦略のパフォーマンスを影響する大きなスライドポイントが速い状況で発生する可能性がある
  3. パラメータの感受性 - ATR周期と係数の選択は,戦略のパフォーマンスに大きな影響を与える
  4. 資金管理のリスク - 取引数が不適切設定された場合,過度なレバレッジのリスクが生じることがあります
  5. 市場の波動のリスク - 激しい波動の時期にストップが瞬時に破損する可能性があります

戦略最適化の方向性

  1. 市場環境の識別メカニズムを導入し,異なる市場状態で異なるパラメータの組み合わせを使用する
  2. 取引量の要素を信号フィルタリング条件として加え,取引信号の信頼性を向上させる
  3. 資金管理アルゴリズムを最適化し,変動率の動向に応じて保有規模を調整する
  4. タイムフィルターを増やして,取引の不適切なタイミングで取引を避ける
  5. パラメータの動的調整を実現する自己適応的なパラメータ最適化システムの開発

要約する

この戦略はATR指標とEMA均線を組み合わせて,信頼性の高いダイナミック・トラッキング・ストップ・システムを構築している.その優点は,市場の波動に自律的に適応でき,完善したリスク管理メカニズムを有し,同時に操作の柔軟性を保つことである.いくつかの固有のリスクがあるが,継続的な最適化と改善によって,戦略は,異なる市場環境で安定したパフォーマンスを維持できる見込みがある.トレーダーは,現場で使用する前に,複数のパラメータの組み合わせを十分にテストし,特定の取引品種の特性に応じてターゲットに最適化することを推奨している.

ストラテジーソースコード
/*backtest
start: 2019-12-23 08:00:00
end: 2024-12-10 08:00:00
period: 1d
basePeriod: 1d
exchanges: [{"eid":"Futures_Binance","currency":"BTC_USDT"}]
*/

//@version=5
strategy(title='ADET GİRMELİ Trend İz Süren Stop Strategy', overlay=true, overlay=true,default_qty_type = strategy.fixed, default_qty_value = 1)

// Inputs
a = input(9, title='Key Value. "This changes the sensitivity"')
c = input(3, title='ATR Period')
h = input(false, title='Signals from Heikin Ashi Candles')

xATR = ta.atr(c)
nLoss = a * xATR

src = h ? request.security(ticker.heikinashi(syminfo.tickerid), timeframe.period, close, lookahead=barmerge.lookahead_off) : close

xATRTrailingStop = 0.0
iff_1 = src > nz(xATRTrailingStop[1], 0) ? src - nLoss : src + nLoss
iff_2 = src < nz(xATRTrailingStop[1], 0) and src[1] < nz(xATRTrailingStop[1], 0) ? math.min(nz(xATRTrailingStop[1]), src + nLoss) : iff_1
xATRTrailingStop := src > nz(xATRTrailingStop[1], 0) and src[1] > nz(xATRTrailingStop[1], 0) ? math.max(nz(xATRTrailingStop[1]), src - nLoss) : iff_2

pos = 0
iff_3 = src[1] > nz(xATRTrailingStop[1], 0) and src < nz(xATRTrailingStop[1], 0) ? -1 : nz(pos[1], 0)
pos := src[1] < nz(xATRTrailingStop[1], 0) and src > nz(xATRTrailingStop[1], 0) ? 1 : iff_3

xcolor = pos == -1 ? color.red : pos == 1 ? color.green : color.blue

ema = ta.ema(src, 1)
above = ta.crossover(ema, xATRTrailingStop)
below = ta.crossover(xATRTrailingStop, ema)

buy = src > xATRTrailingStop and above
sell = src < xATRTrailingStop and below

barbuy = src > xATRTrailingStop
barsell = src < xATRTrailingStop
// Alım ve Satım Sinyalleri
buySignal = src > xATRTrailingStop and above
sellSignal = src < xATRTrailingStop and below

// Kullanıcı girişi
sell_quantity = input.int(1, title="Sell Quantity", minval=1)
buy_quantity = input.int(1, title="Buy Quantity", minval=1)

// Portföy miktarı (örnek simülasyon verisi)
var portfolio_quantity = 0

// Sinyal üretimi (örnek sinyal, gerçek stratejinizle değiştirin)
indicator_signal = (src > xATRTrailingStop and above) ? "buy" : 
                   (src < xATRTrailingStop and below) ? "sell" : "hold"

// Şartlara göre al/sat
if indicator_signal == "buy" and portfolio_quantity < buy_quantity
    strategy.entry("Buy Order", strategy.long, qty=buy_quantity)
    portfolio_quantity := portfolio_quantity + buy_quantity

if indicator_signal == "sell" and portfolio_quantity >= sell_quantity
    strategy.close("Buy Order", qty=sell_quantity)
    portfolio_quantity := portfolio_quantity - sell_quantity
// Plot buy and sell signals
plotshape(buy, title='Buy', text='Buy', style=shape.labelup, location=location.belowbar, color=color.new(color.green, 0), textcolor=color.new(color.white, 0), size=size.tiny)
plotshape(sell, title='Sell', text='Sell', style=shape.labeldown, location=location.abovebar, color=color.new(color.red, 0), textcolor=color.new(color.white, 0), size=size.tiny)

// Bar coloring
barcolor(barbuy ? color.rgb(6, 250, 14) : na)
barcolor(barsell ? color.red : na)

// Alerts
alertcondition(buy, 'UT Long', 'UT Long')
alertcondition(sell, 'UT Short', 'UT Short')

// Strategy Entry and Exit
if buy
    strategy.entry('Long', strategy.long)
if sell
    strategy.entry('Short', strategy.short)

// Optional Exit Conditions
if sell
    strategy.close('Long')
if buy
    strategy.close('Short')