複数期間のトレンド動的ボラティリティ追跡戦略

1
Follow
1781
Followers
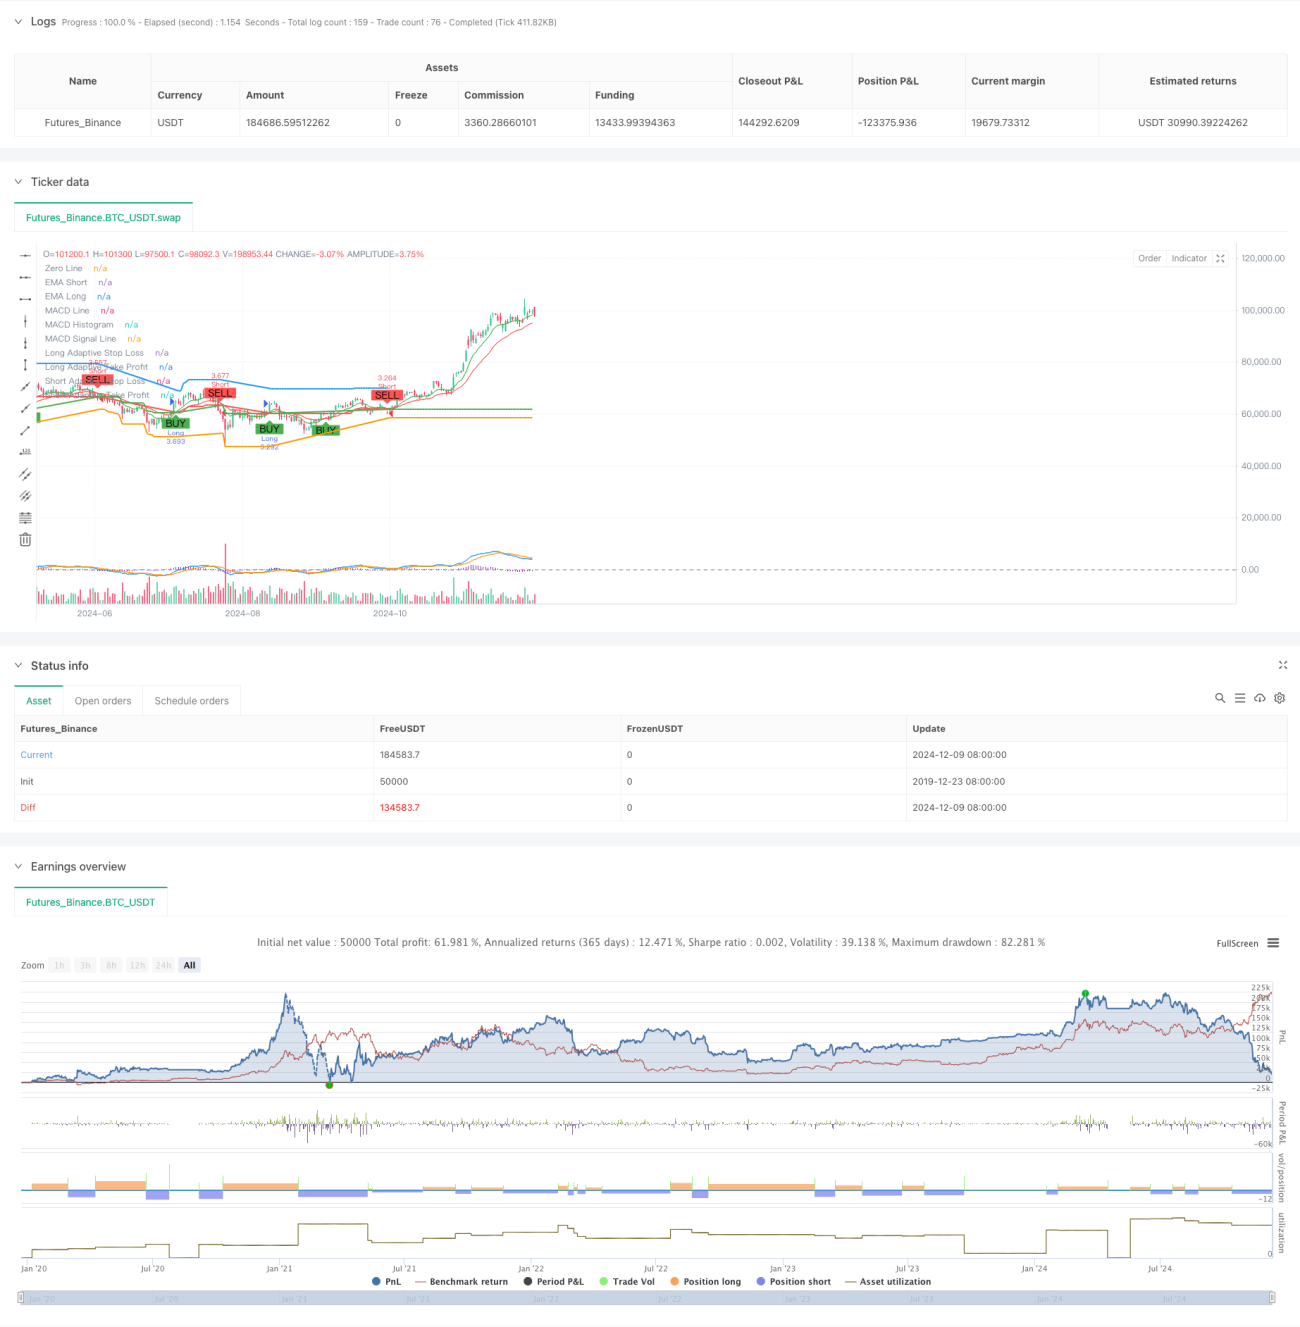
概要
この戦略は,複数の技術指標を組み合わせた自己適応型トレンド追跡システムである.多周期分析とストップ・ローズを動的に調整することで取引パフォーマンスを最適化する.戦略の核心は,均線システムのトレンド識別を利用し,RSIとMACDでトレンドの強さを確認し,ATRの動態に基づいてリスク管理パラメータを調整する.
戦略原則
戦略は,三重検証メカニズムを使用して取引する:1) 急速・緩やかな期間のEMAを交差してトレンドの方向を判断する;2) RSIを活用して買って売って売るレベルとMACDのトレンド確認をフィルタリングする取引信号;3) より高い時間周期EMAを導入してトレンド確認する.リスク管理の面で,戦略はATRの動態に従って止損と利益の目標を調整し,自己適応のポジション管理を実現する.市場の波動が拡大すると,システムは自動的に止損と利益のスペースを広げ,市場が平らになったときに,これらのパラメータを絞って勝利率を上げる.
戦略的優位性
- 多次元信号認証メカニズムにより取引の正確性が著しく向上
- 適応性のある止損停止設定により,異なる市場環境に適応できます.
- より高い時間周期のトレンド確認は,偽突破のリスクを効果的に低下させる
- 良質な警告システムにより,取引の機会とリスクの管理が迅速にできるようになります
- フレキシブルな取引方向設定により,戦略は異なる取引好みに適応できます.
戦略リスク
- マルチ認証は,迅速な取引の機会を逃す可能性があります.
- 市場が激しく波動する中で,動的ストップダメージは早めに発動する可能性があります.
- 横軸整理市場で頻繁に発生する偽信号
- パラメータ最適化過程で過度に適合するリスクがある
- 多周期分析では,異なる時間周期で矛盾信号が発生する可能性があります.
戦略最適化の方向性
- 交差量指標を導入し,信号の信頼性を向上させる
- トレンドの強さを増やすための定量評価システム,入場タイミングを最適化
- 戦略の安定性を高めるための自主的なパラメータ最適化メカニズムの開発
- 市場環境の分類システムへの加入,異なる市場に対して異なるパラメータを使用
- ダイナミックなポジション管理システムを開発し,信号の強さに応じてポジション保有量を調整する
要約する
これは,厳格に設計されたトレンド追跡システムであり,多層の検証機構とダイナミックなリスク管理により,包括的な取引ソリューションを提供します.戦略の核心的な優位性は,自主的な適応性とリスク管理能力にありますが,使用する際には,パラメータ最適化と市場環境のマッチングの問題に注意する必要があります.継続的な最適化と改善により,この戦略は,異なる市場環境で安定したパフォーマンスを維持することが期待されています.
Source
Pine
/*backtest
start: 2019-12-23 08:00:00
end: 2024-12-10 08:00:00
period: 1d
basePeriod: 1d
exchanges: [{"eid":"Futures_Binance","currency":"BTC_USDT"}]
*/

//@version=5
strategy("TrenGuard Adaptive ATR Strategy", overlay=true, default_qty_type=strategy.percent_of_equity, default_qty_value=100)

// ParametersStrategy parameters
Related strategies
Comment
All comments (0)
No data
- 1