平均回帰ボリンジャーバンドドルコスト平均法戦略

BB DCA EMA SMA
作成日: 2024-12-12 17:17:15 最終変更日: 2024-12-12 17:17:15
コピー: 2 クリック数: 452
1
フォロー
1621
フォロワー

平均回帰ボリンジャーバンドドルコスト平均法戦略

概要

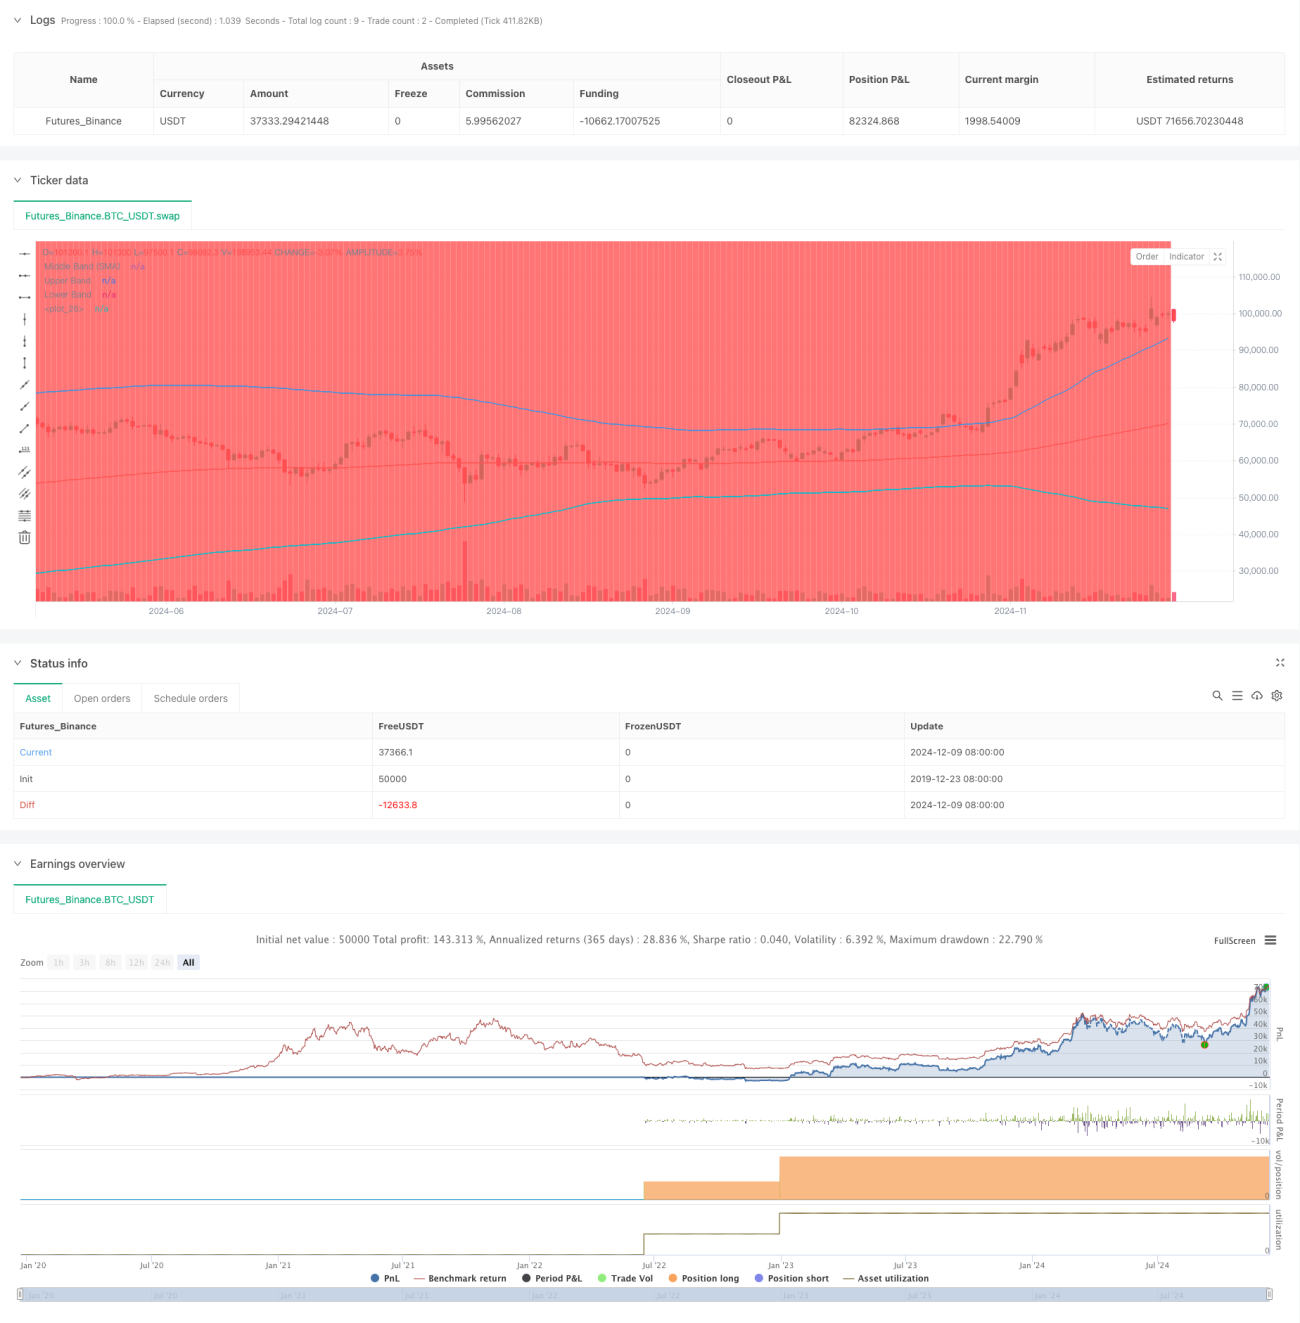
この戦略は,ドルコスト平均法 ((DCA) とブリン帯技術指標を組み合わせたスマートな投資戦略である.これは,価格が逆転するときに体系的に仓庫を建設し,平均回帰の原理を利用して投資する.この戦略の核心は,価格がブリン帯を下回る時に固定金額の買い物を実行し,市場調整期間により良い入場価格を得ることである.

戦略原則

戦略の核心原則は,3つの基礎に基づいています: 1) ドルコスト平均法,定期的な固定金銭投入によって選択時のリスクを軽減する; 2) 平均値回帰理論,価格が最終的に歴史的平均水準に戻ると考える; 3) ブリン帯指数,超買い超売り地域を識別するために. 価格がブリン帯下線を突破すると,買い取り信号を誘発し,購入額は,設定された投資額を現在の価格で決定する. 戦略は,200周期指数移動平均線をブリン帯の軌道として使用し,標準差は2倍で,これにより上下線を定義する.

戦略的優位性

  1. 選択時にリスクを減らす - 主観的な判断ではなく,体系的な購入によって人間の誤差を減らす
  2. 値引きのチャンスを掴む - 価格が上昇すると自動的に買い物を実行する
  3. 柔軟なパラメータ設定 - ブリン帯のパラメータと投資額を異なる市場状況に応じて調整できます
  4. 明確な出入りルール - 技術指標に基づく客観的なシグナル
  5. 自動化された実行 - 感情的な取引を避け,人間の介入を必要としない

戦略リスク

  1. 平均回帰の破綻リスク - 傾向市場ではより多くの偽信号が生じる可能性がある
  2. 資金管理のリスク - 連続した買取シグナルに対応するために十分な資金を準備する必要がある
  3. パラメータ最適化のリスク - 過度な最適化は戦略の失敗につながる
  4. 市場環境への依存性 - 波動的な市場では不振を起こす可能性 これらのリスクを管理するために,厳格な資金管理制度を導入し,定期的に戦略のパフォーマンスを評価することを推奨します.

戦略最適化の方向性

  1. トレンドフィルターを導入し,強気なトレンドで逆転操作を避ける
  2. 複数のタイムサイクル認証メカニズムを追加
  3. 資金管理システムの最適化,変動率の動向に応じて投資額の調整
  4. 価格が平均値に戻った時に利益を得るために,利益の結束の仕組みに加入します.
  5. 他の技術指標と組み合わせて信号の信頼性を向上させる

要約する

これは,技術分析と体系的な投資方法を組み合わせた堅実な戦略である.ブルインによる超落の機会の識別,ドルコスト平均法と連携してリスクを軽減する.戦略の成功の鍵は,パラメータの合理的な設定と厳格な実行規律にある.一定のリスクがあるものの,継続的な最適化とリスク管理によって戦略の安定性を高めることができる.

ストラテジーソースコード
/*backtest
start: 2019-12-23 08:00:00
end: 2024-12-10 08:00:00
period: 1d
basePeriod: 1d
exchanges: [{"eid":"Futures_Binance","currency":"BTC_USDT"}]
*/

//@version=5
strategy("DCA Strategy with Mean Reversion and Bollinger Band", overlay=true) // Define the strategy name and set overlay=true to display on the main chart

// Inputs for investment amount and dates
investment_amount = input.float(10000, title="Investment Amount (USD)", tooltip="Amount to be invested in each buy order (in USD)") // Amount to invest in each buy order
open_date = input(timestamp("2024-01-01 00:00:00"), title="Open All Positions On", tooltip="Date when to start opening positions for DCA strategy") // Date to start opening positions
close_date = input(timestamp("2024-08-04 00:00:00"), title="Close All Positions On", tooltip="Date when to close all open positions for DCA strategy") // Date to close all positions

// Bollinger Band parameters
source = input.source(title="Source", defval=close, group="Bollinger Band Parameter", tooltip="The price source to calculate the Bollinger Bands (e.g., closing price)") // Source of price for calculating Bollinger Bands (e.g., closing price)
length = input.int(200, minval=1, title='Period', group="Bollinger Band Parameter", tooltip="Period for the Bollinger Band calculation (e.g., 200-period moving average)") // Period for calculating the Bollinger Bands (e.g., 200-period moving average)
mult = input.float(2, minval=0.1, maxval=50, step=0.1, title='Standard Deviation', group="Bollinger Band Parameter", tooltip="Multiplier for the standard deviation to define the upper and lower bands") // Multiplier for the standard deviation to calculate the upper and lower bands

// Timeframe selection for Bollinger Bands
tf = input.timeframe(title="Bollinger Band Timeframe", defval="240", group="Bollinger Band Parameter", tooltip="The timeframe used to calculate the Bollinger Bands (e.g., 4-hour chart)") // Timeframe for calculating the Bollinger Bands (e.g., 4-hour chart)

// Calculate BB for the chosen timeframe using security
[basis, bb_dev] = request.security(syminfo.tickerid, tf, [ta.ema(source, length), mult * ta.stdev(source, length)]) // Calculate Basis (EMA) and standard deviation for the chosen timeframe
upper = basis + bb_dev // Calculate the Upper Band by adding the standard deviation to the Basis
lower = basis - bb_dev // Calculate the Lower Band by subtracting the standard deviation from the Basis

// Plot Bollinger Bands
plot(basis, color=color.red, title="Middle Band (SMA)") // Plot the middle band (Basis, EMA) in red
plot(upper, color=color.blue, title="Upper Band") // Plot the Upper Band in blue
plot(lower, color=color.blue, title="Lower Band") // Plot the Lower Band in blue
fill(plot(upper), plot(lower), color=color.blue, transp=90) // Fill the area between Upper and Lower Bands with blue color at 90% transparency

// Define buy condition based on Bollinger Band 
buy_condition = ta.crossunder(source, lower) // Define the buy condition when the price crosses under the Lower Band (Mean Reversion strategy)

// Execute buy orders on the Bollinger Band Mean Reversion condition
if (buy_condition ) // Check if the buy condition is true and time is within the open and close date range
    strategy.order("DCA Buy", strategy.long, qty=investment_amount / close) // Execute the buy order with the specified investment amount

// Close all positions on the specified date
if (time >= close_date) // Check if the current time is after the close date
    strategy.close_all() // Close all open positions

// Track the background color state
var color bgColor = na // Initialize a variable to store the background color (set to 'na' initially)

// Update background color based on conditions
if close > upper // If the close price is above the Upper Band
    bgColor := color.red // Set the background color to red
else if close < lower // If the close price is below the Lower Band
    bgColor := color.green // Set the background color to green

// Apply the background color
bgcolor(bgColor, transp=90, title="Background Color Based on Bollinger Bands") // Set the background color based on the determined condition with 90% transparency

// Postscript:
// 1. Once you have set the "Investment Amount (USD)" in the input box, proceed with additional configuration. 
// Go to "Properties" and adjust the "Initial Capital" value by calculating it as "Total Closed Trades" multiplied by "Investment Amount (USD)" 
// to ensure the backtest results are aligned correctly with the actual investment values.
//
// Example:
// Investment Amount (USD) = 100 USD
// Total Closed Trades = 10 
// Initial Capital = 10 x 100 = 1,000 USD

// Investment Amount (USD) = 200 USD
// Total Closed Trades = 24 
// Initial Capital = 24 x 200 = 4,800 USD