歴史的な高値ブレイクスルーと月間移動平均フィルターを組み合わせたトレンドフォロー型の定量取引戦略

1
Follow
1781
Followers
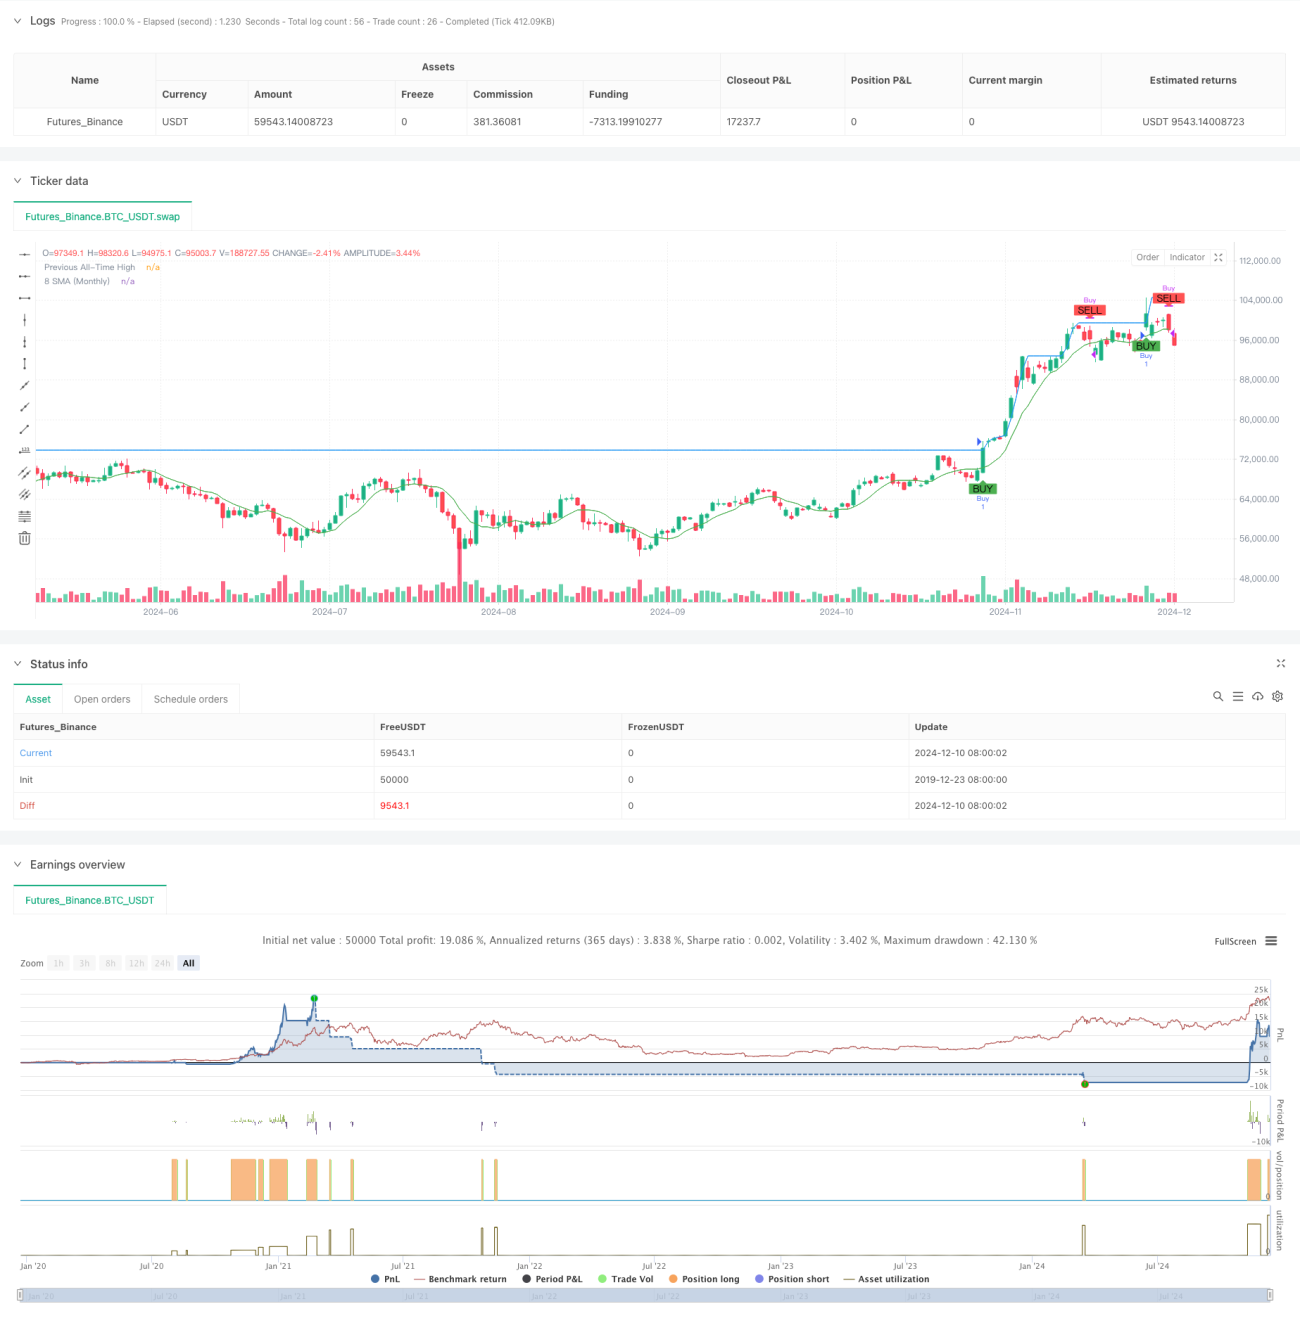
概要
この戦略は,歴史的な新高の突破と月経平均線のフィルターに基づくトレンド追跡戦略である.これは,価格が突破するかどうか以前の歴史的な最高点を監視することによって,買入シグナルを探し,月経8周期の単純な移動平均 ((8SMA) を販売フィルタ条件として使用し,偽の突破によるリスクを軽減する.この戦略の設計理念は",トレンドの継続性"という市場特性に適合し,特に強い上昇傾向の中で大レベルの動きを捉えるのに適している.
戦略原則
戦略の核心的な論理には2つの重要な部分があります.
- 買取信号:最新の閉盤価格が前期の歴史的最高値を突破したときに (現在のK線の最高値を含まない) システムで買取信号が生成されます. この条件は,明確な上昇傾向の中でのみ入場を保証します.
- 売出シグナル:月経線の閉盘価格が8周期のSMOを下回ったときに,システムが売出シグナルをトリガーする.この条件は,トレンドの逆転がより大きな損失を引き起こすのを防ぐために,早期に損失を止めるのに役立ちます.
策略はまた,信号状態の追跡機構を設計し,同じ状態で繰り返し信号を生成することを避けるため,策略の安定性を高めます.
戦略的優位性
- トレンド把握能力:過去新高の判断により,強力な上昇傾向を効果的に捉えることができる.
- リスクコントロールの完善:月線均線をフィルタ条件として組み合わせて,偽突破を効果的にフィルタリングできる.
- 信号安定性:lastSignal変数によって信号状態を追跡し,重複信号発生を回避する.
- 視覚効果: 戦略は明確なグラフィカルインターフェースを提供し,歴史の高点線,平均線,買入シグナルマークを含む.
- 適応性:戦略は,異なる時間周期と品種に適用できます.
戦略リスク
- 遅滞の危険性:過去最高突破の信号は,本質的に遅滞性があり,最高の入場時間を逃す可能性があります.
- 偽突破リスク:月線均線フィルターがあるが,揺れ動いている市場では偽突破が発生する可能性がある.
- 逆転のリスク:トレンドの転換点において,戦略は大きな逆転を強いられる.
- 資金管理リスク:戦略にはポジション管理機構が含まれていないため,追加の資金管理規則が必要である.
戦略最適化の方向性
- 引入量確認: 交付量指標を突破確認条件として追加して信号の信頼性を高めることができる.
- 改善された止損機構: 追跡止損または変動率止損などのより柔軟な止損ルールを設計できます.
- ポジション管理を追加:市場の変動率とトレンドの強さに応じてポジションの大きさを動的に調整する.
- 信号フィルタリングの最適化:トレンドの強度指標,ADXのようなものを追加して,弱点信号をさらにフィルタリングできます.
- タイムフィルターを追加: タイムサイクルフィルターを追加して,不適切な時間帯で取引を避ける.
要約する
これは合理的で論理的に明確なトレンド追跡戦略である.歴史的に新高の突破と月線平均線の併用により,トレンドの有効な把握が保証され,リスクの合理的な管理が実現する.一定の遅れや偽突破のリスクがあるものの,推奨された最適化方向によって,戦略の全体的なパフォーマンスはさらに向上する見込みがある.この戦略は,明確なトレンドの市場環境で特に適しています.
Source
Pine
Related strategies
Comment
All comments (0)
No data
- 1