二重移動平均ストキャスティックトレンドフォロー取引戦略

1
Follow
1781
Followers
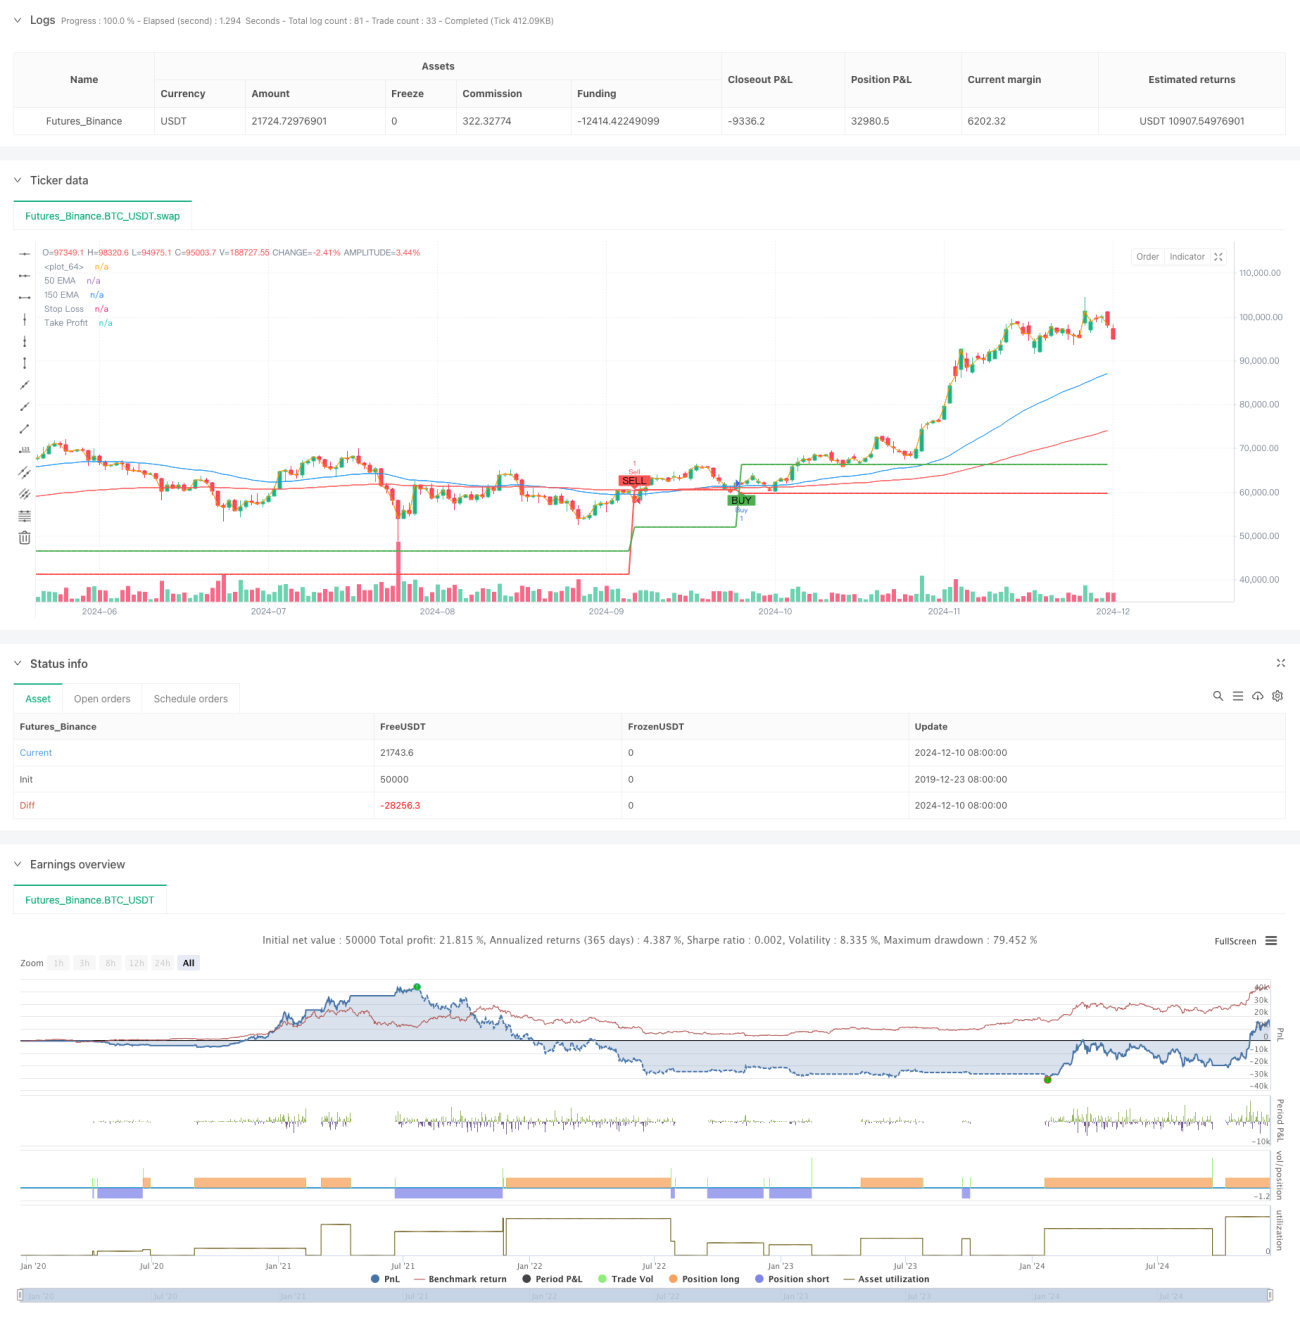
概要
この戦略は,双均線とランダムな指標 (ストキャスティック) をベースにしたトレンド追跡取引システムである.この戦略は,均線システムを組み合わせて市場トレンドを判断し,同時にランダムな指標を使用して,オーバーバイのオーバーセール領域の交差信号を捕捉し,リスクを制御するために動的なストップ・ローズ・レベルを設定する.この方法は,取引信号の信頼性を保証するとともに,各取引のリスク/リターン比率を効果的に管理する.
戦略原則
この戦略は,以下の要素を中心に取引を行います.
- 50期と150期の指数移動平均 ((EMA) を使って市場のトレンド方向を判断する
- ランダムな指標 ((14,3,3) を使って,超買超売領域を識別する
- トレンドの方向でランダムな指標を探し出す交差点
- 最近の価格変動に基づいて設定された動的ストップポイント
- リスクと利益の比率を1:2で設定する
購入条件は同時に満たされている必要があります:
- 50日平均線と150日平均線より高い閉盘価格
- 50日平均線は150日平均線の上にある
- ランダムな指標K値が30未満で,K線がD線を上向きに通過する
売る条件は逆です
- 50日平均線と150日平均線を下回る
- 50日平均線は150日平均線の下にある.
- ランダムな指標K値は70以上で,K線はD線を下向きに通過する
戦略的優位性
- 複数の認証メカニズムの信頼性向上
- 平均線システムによる大トレンド確認
- ランダムな指標を使用して偽信号をフィルタリング
- 信号は複数の条件を満たす必要があります
- 優れたリスク管理システム
- 最近のサポートレジスタンスに基づく動的ストップ
- 固定リスクの収益は,最適化された期待収益より大きい
- 偽突破のリスクを減らす傾向が確認された
- 適応性が高い
- 複数のタイムサイクルに適用できます.
- パラメータは市場特性に合わせて調整できます.
- 波動性のある市場に適しています.
戦略リスク
- 市場が揺れ動いた
- 平均線を頻繁に突破すると,偽信号が発生します.
- 傾向がはっきりしたときに使用することが推奨されます.
- トレンドフィルターの改善
- ストップオフの設定リスク
- 過剰な圧縮は,頻繁に停止する可能性があります.
- 松山は大きな損失を被る可能性がある.
- 市場変動に合わせて調整する必要がある
- 遅滞のリスク
- 均線システムは遅れている.
- トレンドの始まりを見逃しているかもしれません
- 入り口の選択は慎重にしてください
戦略最適化の方向性
- トレンド強度フィルター
- ADX指標が追加され,トレンドの強さを測定します.
- 設定する 最小トレンド強度<unk>値
- 弱いトレンドで取引を避ける
- ランダムな指標パラメータを最適化
- 市場特性に合わせたパラメータ
- 適応パラメータを使用する
- 他の技術指標の確認を追加
- <unk>止装置の改善
- 追跡・ストップを考慮する
- 変動率の動向による調整
- リスクと利益の相関を最適化する設定
要約する
これは,トレンド追跡と動的取引を組み合わせた完全な戦略システムである.均線システムとランダムな指標の組み合わせによる使用により,取引方向が主動トレンドに適合することを保証するとともに,適切な価格領域で取引することができる.また,戦略は,ダイナミックな止損と固定されたリスク収益比率を使用してリスクを制御するための完善したリスク管理機構を含んでいる.いくつかの固有の制限があるが,推奨された方向の最適化によって戦略の全体的なパフォーマンスはさらに向上することができる.実際のアプリケーションでは,取引者は,特定の市場特性と自身のリスク好みに応じてパラメータを適切に調整することを推奨する.
Source
Pine
Related strategies
Comment
All comments (0)
No data
- 1