
1
Follow
1781
Followers
概要
この戦略は,波リンガー帯 (Bollinger Bands) に基づく動量突破取引システムで,主に価格と波リンガー帯の軌道上の関係によってトレンドの機会を捕捉する.この戦略は,自己適応の均線型選択機構を採用し,標準差チャネルと組み合わせて市場の波動特性を識別し,特に波動性の高い市場環境で適用する.
戦略原則
戦略の中核となるロジックは、次の主要な要素に基づいています。
- カスタマイズ可能な移動平均 ((SMA,EMA,SMMA,WMA,VWMAを含む) を使ってポーリング帯の計算中軌道.
- 標準差の倍数 ((デフォルト2.0) 動的に上下線位置を決定する。
- 価格が突破軌道に乗ったときに,入場が多くなることは,強烈な突破傾向の形成を示している。
- 価格が下落した時に平仓の出場は,上昇傾向が終わったかもしれないことを示している.
- システムには取引コスト ((0.1%) とスライドポイント ((3ポイント) の考慮が組み込まれているため,実際の取引環境に適しています.
戦略的優位性
- 適応性: 多数の平均線型を選択することで,戦略は異なる市場条件に適応できます.
- リスクコントロールの改善: 波リンガー下線をストップポイントとして使用することで,明確なリスクコントロールが提供される.
- 資金管理は合理的:ポジションの比率管理方式を採用し,固定手数によるリスクを回避する.
- 取引コストを十分に考慮して,手数料とスライドポイントを考慮して,結果が現実に近い.
- タイムフレームの柔軟性:パラメータ設定により特定の取引時間範囲を選択できます.
戦略リスク
- フェイクブレイクリスク: 波動的な市場では頻繁にフェイクブレイクシグナルが発生する可能性があります.
解決法: 確認指数や遅延入場メカニズムを追加する - トレンド反転リスク: 強いトレンドの市場が突然反転した場合,大きな損失を招く可能性があります.
解決策: 傾向強度フィルターを追加する - パラメータの感度: パラメータの組み合わせが異なると、戦略のパフォーマンスに大きな違いが生じる可能性があります。
解決策: 十分なパラメータ最適化と安定性テストが必要である.
戦略最適化の方向性
- トレンドの強さの指標を紹介する.
- 弱気なトレンド市場のシグナルをフィルターするためにADXまたは類似の指標を追加できます.
- 破口を偽造した被害を減らすために
- 損失を抑えるための最適化:
- ダイナミックなストップを実現できます.
- 傾向が続くとより大きな利益を得られる
- トランザクションフィルターを追加:
- 取引量に基づく確認信号
- 流動性の低い環境での取引を避ける
- 登録の改善:
- 復帰のためのメカニズムは増える
- チケットの価格が上がる
要約する
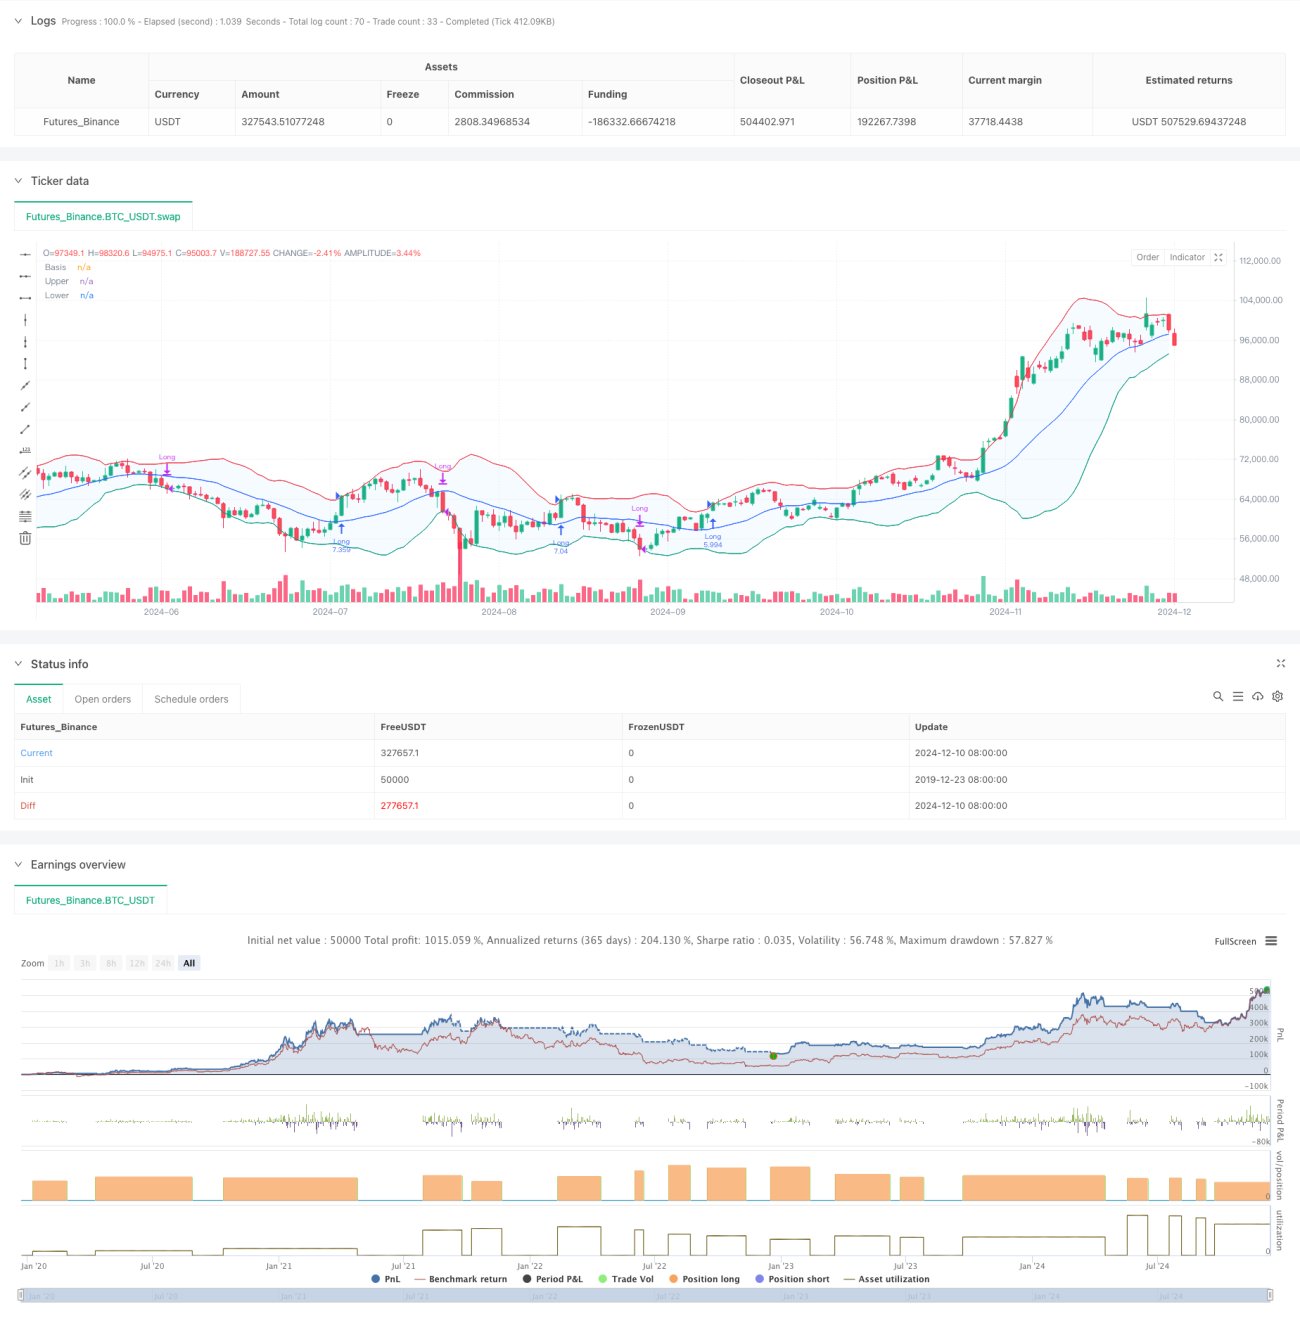
これは,合理的で論理的に明確なトレンド追跡戦略である.これは,ポーリング帯の動的特性を利用して市場の動力を捉え,優れたリスク制御機構を有している.戦略のカスタマイズ性が強く,パラメータを調整することで異なる市場環境に適応することができる.実態の適用時に十分なパラメータ最適化と反テストを推奨し,推奨された最適化方向と組み合わせた戦略改善を行う.
Source
Pine
/*backtest
start: 2019-12-23 08:00:00
end: 2024-12-11 08:00:00
period: 1d
basePeriod: 1d
exchanges: [{"eid":"Futures_Binance","currency":"BTC_USDT"}]
*/

//@version=5
strategy("Demo GPT - Bollinger Bands", overlay=true, initial_capital=10000, commission_type=strategy.commission.percent, commission_value=0.1, slippage=3, default_qty_type=strategy.percent_of_equity, default_qty_value=100)

// InputsStrategy parameters
Related strategies
Comment
All comments (0)
No data
- 1