
1
Follow
1781
Followers
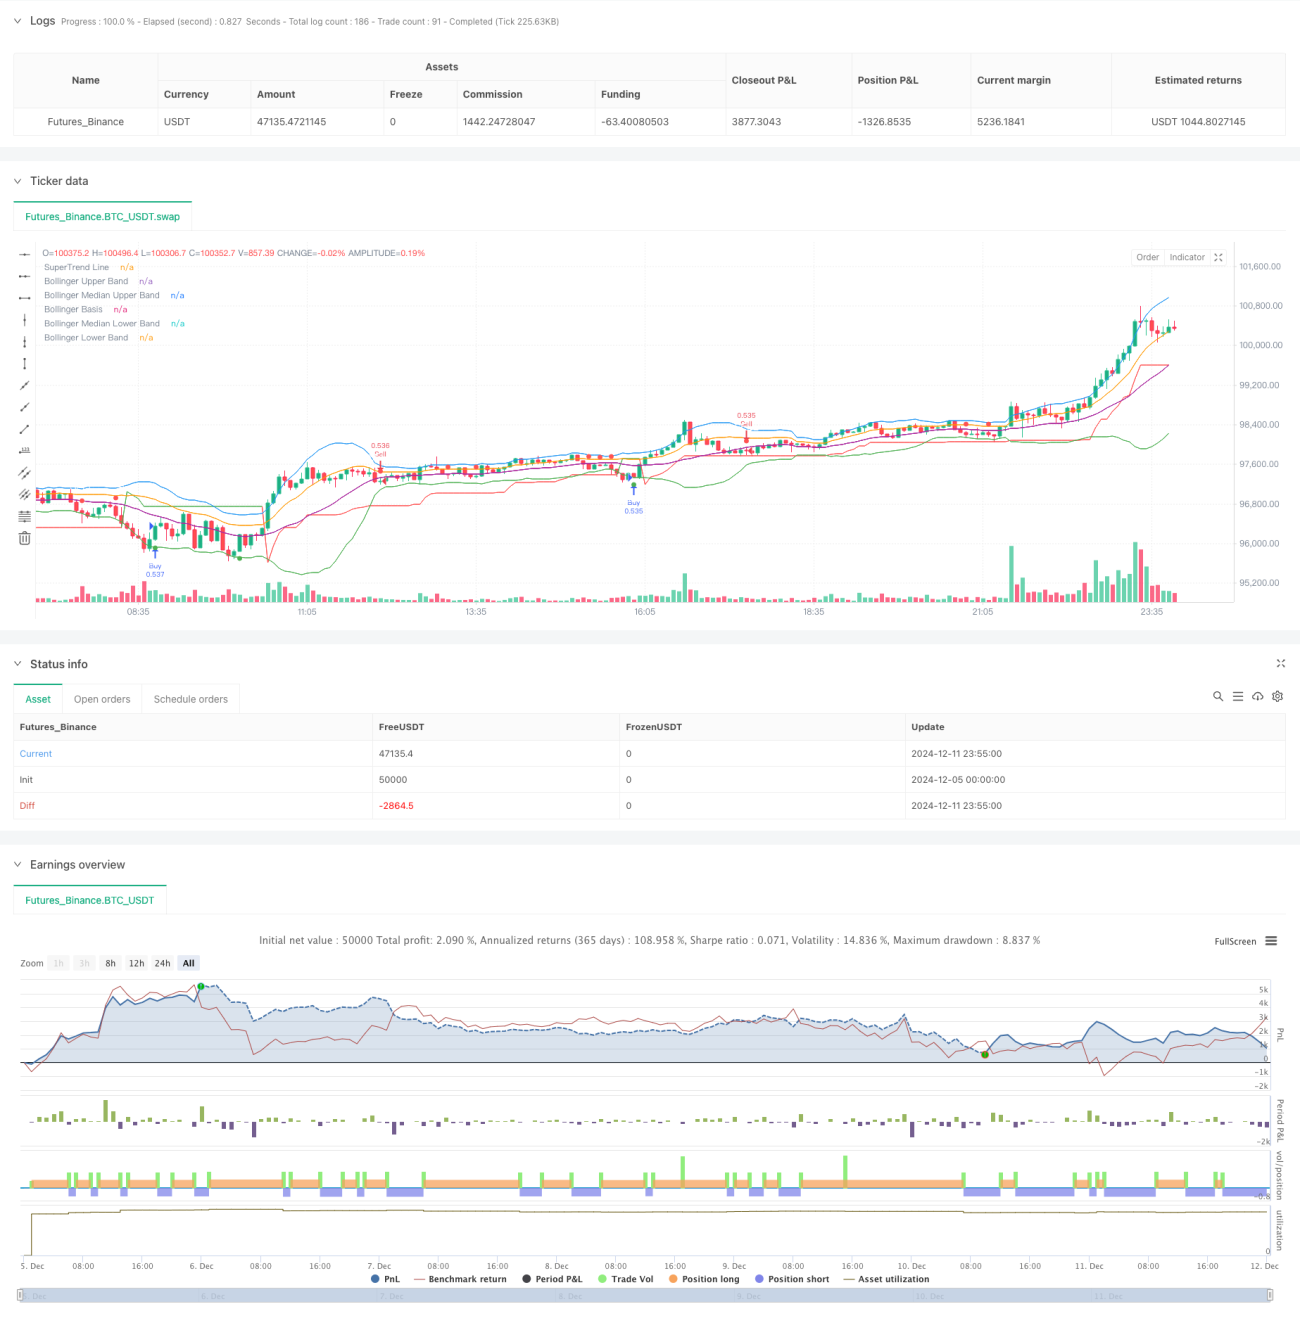
戦略概要
これは,ブリン帯と超トレンド指標を組み合わせたスマートな取引戦略である.この戦略は,主にブリンによって市場の波動区間を識別し,同時に超トレンド指標を使用して市場のトレンド方向を確認し,高確率の位置で取引を行う.この戦略は,さまざまな取引品種と時間周期に適した設計で,特に30分と2時間の周期で良好なパフォーマンスを発揮する.
戦略原則
戦略の中核となるロジックは、次の主要な要素に基づいています。
- 20周期のブリン帯を使用し,帯域は2標準差で,上線,中線,下線と2つの中線を構成する
- 10サイクルATRと3倍因子による超トレンド指標
- 入口信号:
- 多頭入場:価格がブリン帯下線に触れて,超トレンドの指標が多頭方向であるとき
- 空頭入場:価格がブリン帯に触れて上線し,超トレンドの指数は空頭方向であるとき
- スタート信号:
- 多頭出場: 閉盤価格が超トレンドラインを下回り,トレンドが空頭に転じるとき
- 空頭出場: 閉盤価格が超トレンドラインを突破し,トレンドが多頭に転じるとき
戦略的優位性
- 双重確認メカニズムは取引の信頼性を高め,ブリン帯の波動範囲とスーパートレンドの方向性を判断し,偽の突破のリスクを効果的に軽減します.
- 市場波動に自律的に適応する:ブリン帯は,市場波動に合わせて自律的に帯域を調整し,戦略に適した適応性を備える
- 明確な取引シグナル:入場・出場条件が明確で,実行し,追跡しやすい
- 柔軟なパラメータ設定: ブリン帯長,帯幅倍数,超トレンドパラメータを異なる市場条件に応じて調整できます
- 優れた視覚効果:分析と監視を容易にするために,異なる色や形状で取引信号をマークする
戦略リスク
- 横盤の振動で頻繁に偽信号が生じる可能性
- 落後リスク: ブリン帯とスーパートレンドは落後指数であり,速い動きで最適な入場点を逃す可能性があります.
- パラメータ感度: パラメータ設定が異なると、戦略のパフォーマンスに大きな違いが生じる可能性があります。
戦略には以下のリスク管理が推奨されています.
- ストップ・ローズを設定して単価リスクをコントロールします.
- 取引を停止することを検討する
- 市場の変化に対応するためにパラメータを定期的に最適化
戦略最適化の方向性
- 市場変動のフィルタリングを増やす:
- ポジションのサイズを高変動環境で調整する
- ATRフィルターを追加し,過度の波動期間の取引を避ける
- ストップ・ローズ・メカニズムの改善:
- ブリン 帯域幅の動的設定によるストップ・ロズ位置
- 超トレンドの斜率と組み合わせた動的ストップ戦略
- タイムフィルターを追加:
- 重要データ公開の時間を回避する
- 異なる時間帯に異なるパラメータを設定します.
- 信号確認の最適化:
- 音量を上げる確認
- トレンド強度指数を増やすことを検討
要約する
これは,技術分析のクラシック指標を組み合わせた完全な取引システムであり,ブリン帯とスーパートレンドの協同作用により,トレンドと変動の両方で良好なパフォーマンスを発揮することができる.戦略の可視化設計とパラメータの柔軟性は,優れた実用性を有する.戦略の安定性と収益性をさらに向上させるための推奨された最適化方向によって.
Source
Pine
/*backtest
start: 2024-12-05 00:00:00
end: 2024-12-12 00:00:00
period: 5m
basePeriod: 5m
exchanges: [{"eid":"Futures_Binance","currency":"BTC_USDT"}]
*/

//@version=5
strategy("Bollinger Band & SuperTrend Strategy (Standard Chart)", overlay=true, default_qty_type=strategy.percent_of_equity, default_qty_value=100)

// Bollinger Bands SettingsStrategy parameters
Related strategies
Comment
All comments (0)
No data
- 1