ブラックスワンボラティリティと移動平均クロスオーバーモメンタム追跡戦略

1
Follow
1781
Followers
概要
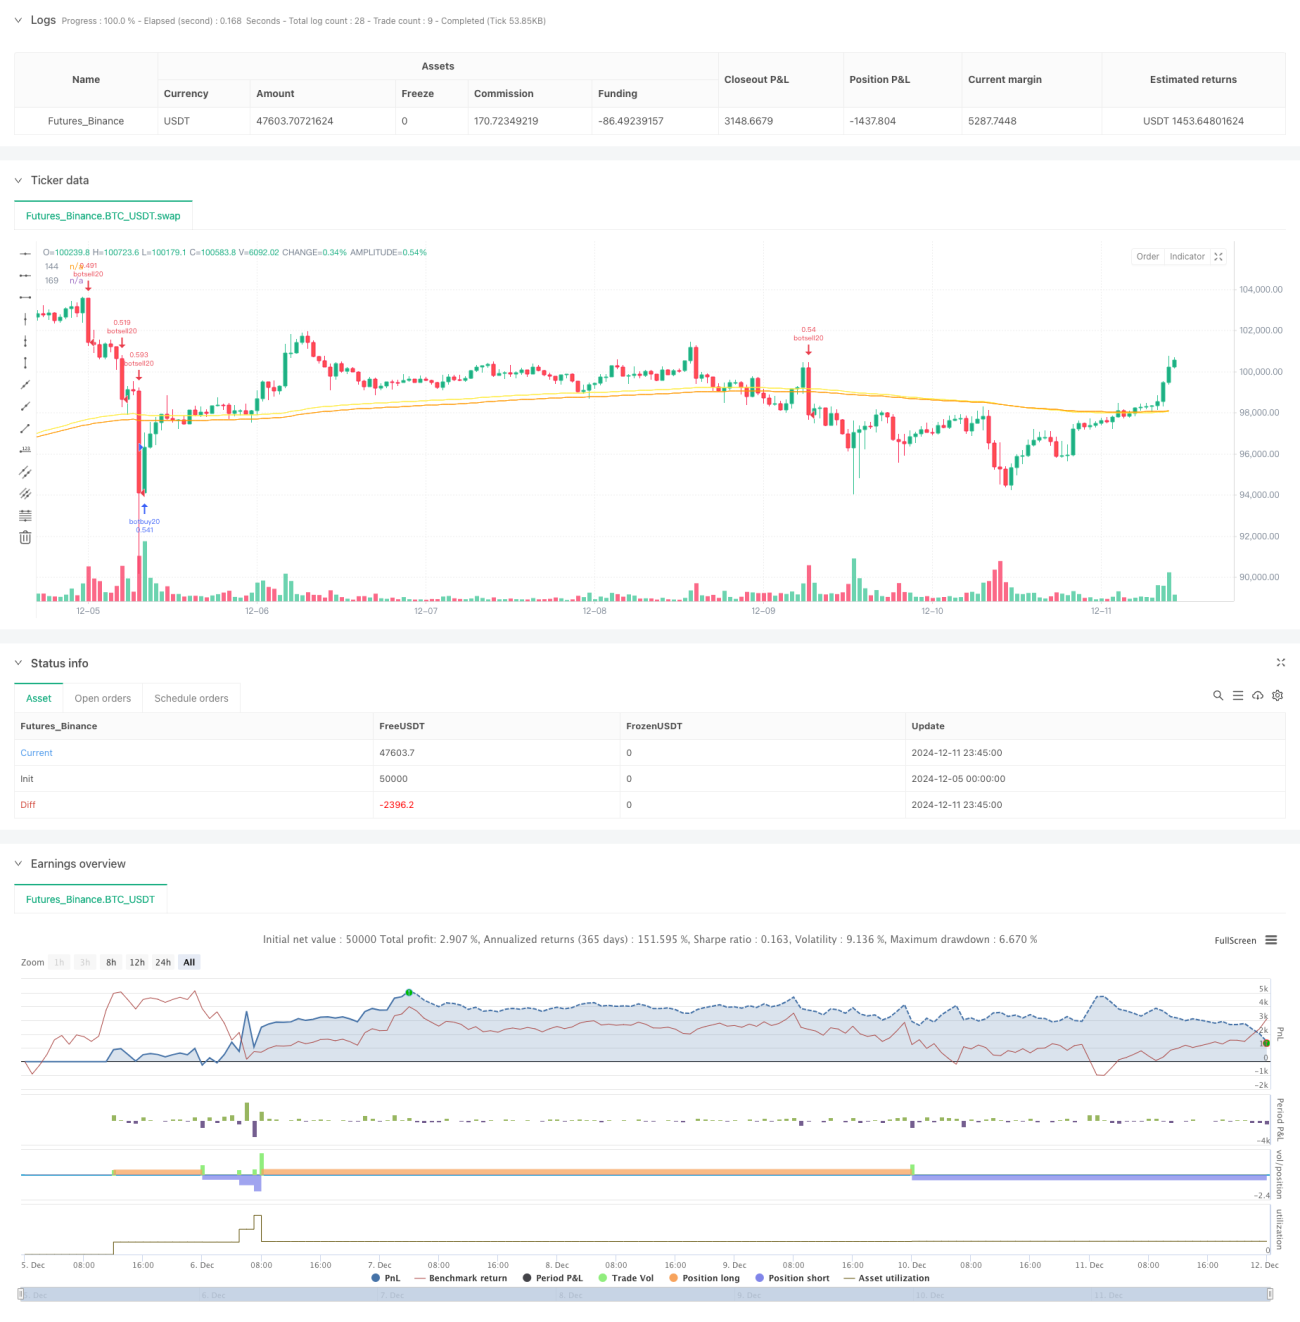
この戦略は,価格変動の幅と均線交差に基づく動態追跡取引システムである.戦略は,主に価格変動率1.91%を超える異常波動 ("ブラック・スウェン・イベント") を監視することによってシグナルを誘発し,同時にEMA144とEMA169の交差を組み合わせてトレンドの方向と退出のタイミングを確認する.この戦略は,特に1-3分間の短い周期の取引に適しており,市場の激しい波動の機会を迅速に捕捉することができる.
戦略原則
戦略の核心的な論理は以下の2つの部分から成り立っています.
- 変動率モニタリング: 価格の変動を測定する為,閉盤価格と開盤価格の絶対差を閉盤価格の比率に計算し,比率が1.91%を超えると取引シグナルをトリガーする.
- トレンド確認:トレンドの方向を確認するためにEMA144とEMA169の交差を使用し,交差アップは多し,交差ダウンは空いている.また,SMA60とSMA20を補助指標として導入した.
策略は1.91%以上の上昇波動を検知したときに多額の取引を行い,下方波動を検知したときに空白を行う.平線が逆転交差したとき,策略は自動的にポジションを平準化してリスクを制御する.
戦略的優位性
- 迅速な対応: 戦略は市場の激しい波動をタイムリーに捉え,特に短期取引に適しています.
- リスクコントロール:平仓信号として均線交差を用い,ポジションのリスクを効果的にコントロールする.
- 高柔軟性:戦略は,反測時間範囲とパラメータの調整を許可し,異なる市場状況に応じて最適化することができます.
- 優れたポジション管理:口座の純資産のパーセントでポジションコントロールを行い,ピラミッドの3倍まで加仓をサポートします.
戦略リスク
- 偽の突破リスク: 波動が強い市場では偽のシグナルが発生し,不必要な取引が起こる可能性があります.
- スライドポイントリスク:戦略が短い周期で動作するので,大きなスライドポイントの損失に直面する可能性があります.
- トレンド反転リスク: 激しい変動の後,トレンドが急速に反転する可能性がある状況.
- パラメータの感受性: 策略効果はパラメータの設定に敏感であり,異なる市場条件で頻繁に調整する必要がある.
戦略最適化の方向性
- 波動率のフィルター導入:市場騒音をフィルタリングし,信号品質を向上させるためATRの追加が推奨されている.
- 入学時間を最適化:入学時間の正確性を向上するために,入学量確認の追加を検討できます.
- 動的調整パラメータ:市場状況に応じてトリガー<unk>値を自動的に調整する適応パラメータシステムを開発することを提案する.
- ストップ・損失の改善: ストップ・損失の追跡機能を追加し,既得利益の保護を図る.
要約する
この戦略は,波動率モニタリングと均線交差を組み合わせて,市場の異常な波動に迅速に反応し,トレンドを追跡します.戦略は合理的に設計され,優れたリスク管理機構がありますが,実際の市場状況に応じてトレーダーによるパラメータ最適化とリスク管理が必要です. リアルタイム取引で小さなポジションから始め,さまざまな市場環境下での戦略のパフォーマンスを段階的に検証することをお勧めします.
Source
Pine
Strategy parameters
Related strategies
Comment
All comments (0)
No data
- 1