ダイナミックレンジフィルターと組み合わせた高度な定量的トレンドキャプチャ戦略

EMA MA RF VOL SMA HA
作成日: 2024-12-17 14:31:11 最終変更日: 2024-12-17 14:31:11
コピー: 4 クリック数: 420
1
フォロー
1617
フォロワー

ダイナミックレンジフィルターと組み合わせた高度な定量的トレンドキャプチャ戦略

概要

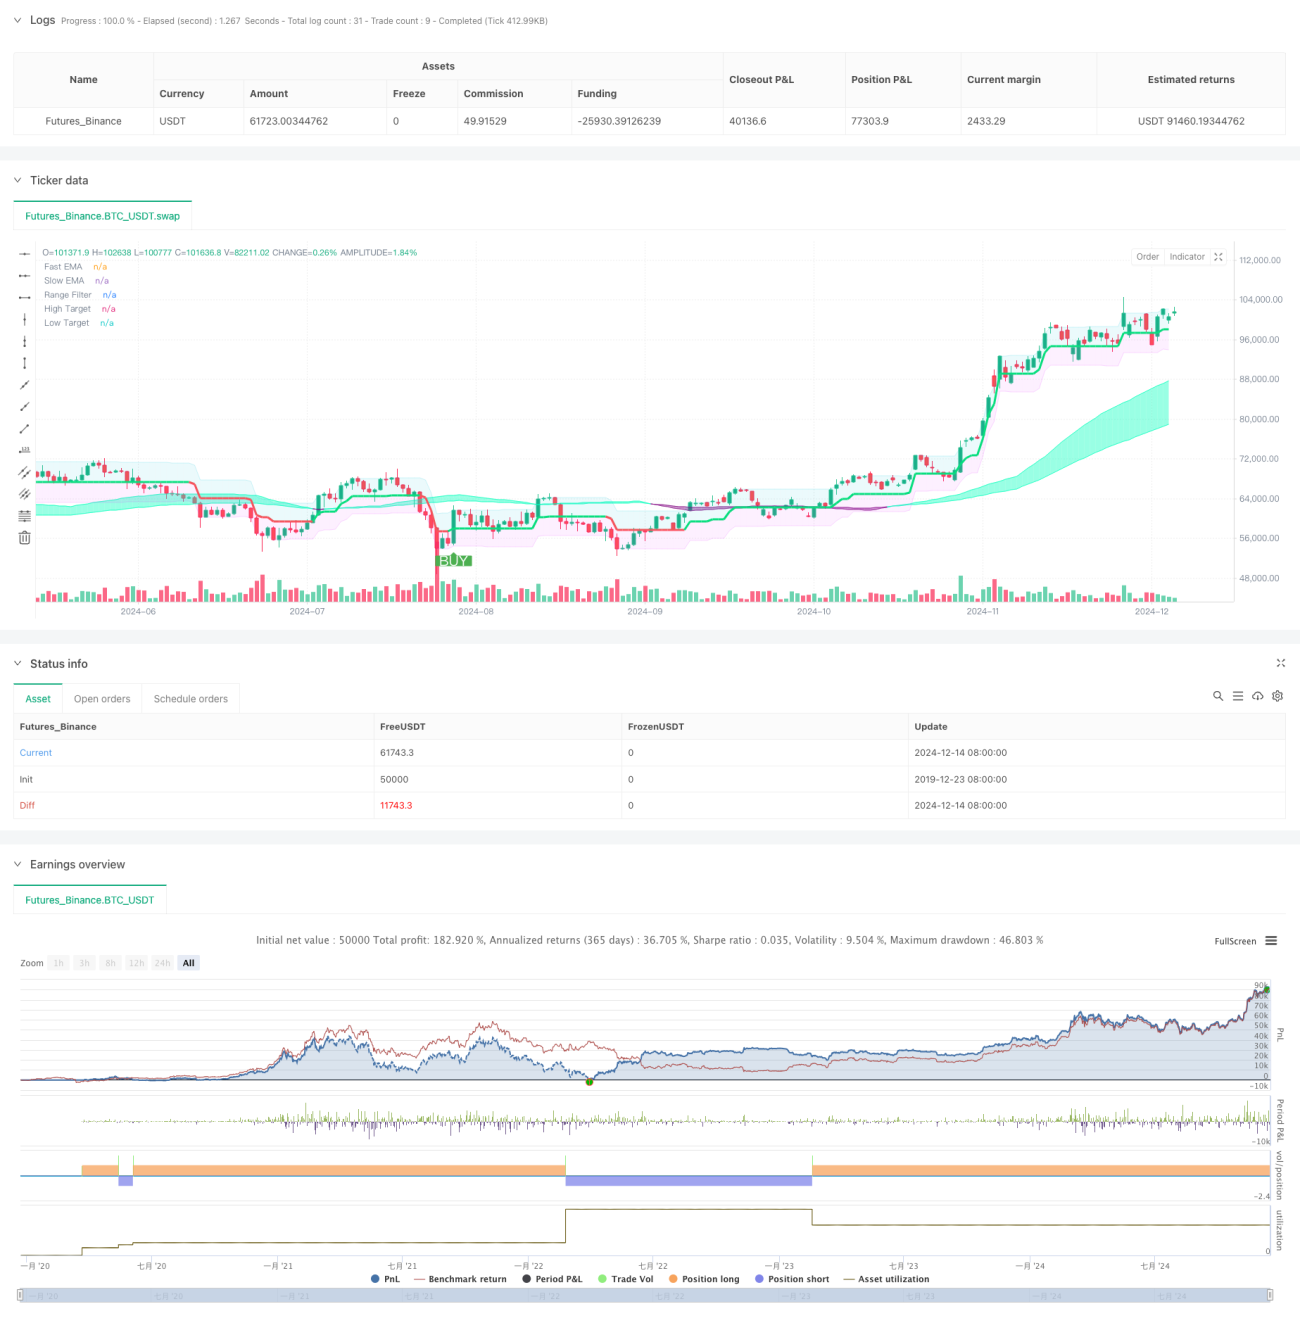
この戦略は,移動平均とダイナミック・レンジ・フィルターを組み合わせた高度な量化取引システムである.これは,価格の変化と取引量との関係を分析することによって,主に市場トレンドを識別し,範囲フィルターを活用して偽信号をフィルターして取引の正確性を向上させる.この戦略は,市場の流動性の境界を決定するために自己適応的な計算方法を採用し,急速な移動平均と遅い移動平均を組み合わせて,トレンドの方向性を確認する.

戦略原則

戦略の核心的な論理は,以下のいくつかの重要な計算に基づいています.

  1. 流動性分析:取引量と価格変動の比率を計算して市場の流動性を評価し,動的流動性の境界を設定する.
  2. トレンド確認:50周期と100周期の指数移動平均 ((EMA) を使用してトレンド方向を確認する.
  3. 範囲フィルタリング:50サイクルのサンプリングサイクルと3倍の範囲の倍数を使用して,ダイナミックな取引区間を構築する.
  4. シグナル生成:価格が範囲フィルターを突破し,EMA指標がトレンドを一致しているときに取引シグナルを生成する.

戦略的優位性

  1. 適応性: 戦略は,市場状況に応じてパラメータを動的に調整し,異なる市場環境に適応します.
  2. 信号信頼性:複数の技術指標とフィルターを組み合わせることで,偽信号を効果的に減少させる.
  3. リスク管理の改善: ストップ・ロズ・ポジションの自動計算を統合し,リスクを効果的に制御する.
  4. 回測機能が完備: 詳細な回測設定が含まれ,戦略を最適化することが容易である.

戦略リスク

  1. パラメータの感受性: 戦略の複数のパラメータは細かく調整され,過度に最適化されやすい.
  2. スリップポイントの影響: 波動が強い市場では,スリップポイントのリスクが大きい可能性があります.
  3. 市場適応性:横盤市場では頻繁に偽信号が生じることがあります.
  4. 資金管理: 固定資金の配分は,すべての市場条件に適していない可能性があります.

戦略最適化の方向性

  1. パラメータの自己適応: 市場状況に応じてパラメータを自動的に調整できるように,自己適応のパラメータ調整メカニズムを導入することができる.
  2. 市場状況認識:市場状況判断モジュールを追加し,異なる市場条件で異なる取引戦略を採用する.
  3. 資金管理の最適化:ダイナミックなポジション管理を導入し,市場の変動に応じて取引規模を調整する.
  4. 信号フィルタリングの強化: 偽信号をフィルタリングするために,より多くの技術指標を追加できます.

要約する

この戦略は,流動性分析,トレンド追跡,範囲フィルタを組み合わせて,完全な量化取引システムを構築する.その優点は,市場の変化に適応し,信頼できる取引シグナルを提供できることです.しかし,パラメータの最適化とリスク管理にも注意する必要があります.継続的な最適化と改善により,この戦略は,異なる市場環境で安定したパフォーマンスを維持することが期待されています.

ストラテジーソースコード
/*backtest
start: 2019-12-23 08:00:00
end: 2024-12-15 08:00:00
period: 1d
basePeriod: 1d
exchanges: [{"eid":"Futures_Binance","currency":"BTC_USDT"}]
*/

//@version=6
strategy("Killer Coin V2 + Range Filter Strategy", shorttitle="KC-RF Strategy", overlay=true
         )

// === INPUT BACKTEST RANGE ===
useDate = input(true, title='---------------- Use Date ----------------', group="Backtest Settings")
FromMonth = input.int(7, title="From Month", minval=1, maxval=12, group="Backtest Settings")
FromDay = input.int(25, title="From Day", minval=1, maxval=31, group="Backtest Settings")
FromYear = input.int(2019, title="From Year", minval=2017, group="Backtest Settings")
ToMonth = input.int(1, title="To Month", minval=1, maxval=12, group="Backtest Settings")
ToDay = input.int(1, title="To Day", minval=1, maxval=31, group="Backtest Settings")
ToYear = input.int(9999, title="To Year", minval=2017, group="Backtest Settings")
start = timestamp(FromYear, FromMonth, FromDay, 00, 00)
finish = timestamp(ToYear, ToMonth, ToDay, 23, 59)
window() => time >= start and time <= finish

// === KILLER COIN V2 INPUTS ===
outlierThreshold = input.int(10, "Outlier Threshold Length", group="Killer Coin Settings")
fastMovingAverageLength = input.int(50, "Fast MA length", group="Killer Coin Settings")
slowMovingAverageLength = input.int(100, "Slow MA length", group="Killer Coin Settings")

// === RANGE FILTER INPUTS ===
sources = input(close, "Source", group="Range Filter Settings")
isHA = input(false, "Use HA Candles", group="Range Filter Settings")
per = input.int(50, "Sampling Period", minval=1, group="Range Filter Settings")
mult = input.float(3.0, "Range Multiplier", minval=0.1, group="Range Filter Settings")

// === KILLER COIN V2 CALCULATIONS ===
priceMovementLiquidity = volume / math.abs(close - open)
liquidityBoundary = ta.ema(priceMovementLiquidity, outlierThreshold) + ta.stdev(priceMovementLiquidity, outlierThreshold)
var liquidityValues = array.new_float(5)

if ta.crossover(priceMovementLiquidity, liquidityBoundary)
    array.insert(liquidityValues, 0, close)

fastEMA = ta.ema(array.get(liquidityValues, 0), fastMovingAverageLength)
slowEMA = ta.ema(array.get(liquidityValues, 0), slowMovingAverageLength)

// === RANGE FILTER CALCULATIONS ===
src = isHA ? request.security(ticker.heikinashi(syminfo.tickerid), timeframe.period, sources) : sources

// Smooth Average Range
smoothrng(x, t, m) =>
    wper = (t*2) - 1
    avrng = ta.ema(math.abs(x - x[1]), t)
    smoothrng = ta.ema(avrng, wper)*m
    smoothrng

smrng = smoothrng(src, per, mult)

// Range Filter
rngfilt(x, r) =>
    rngfilt = x
    rngfilt := x > nz(rngfilt[1]) ? ((x - r) < nz(rngfilt[1]) ? nz(rngfilt[1]) : (x - r)) : ((x + r) > nz(rngfilt[1]) ? nz(rngfilt[1]) : (x + r))
    rngfilt

filt = rngfilt(src, smrng)

// Filter Direction
upward = 0.0
upward := filt > filt[1] ? nz(upward[1]) + 1 : filt < filt[1] ? 0 : nz(upward[1])
downward = 0.0
downward := filt < filt[1] ? nz(downward[1]) + 1 : filt > filt[1] ? 0 : nz(downward[1])

// Target Bands
hband = filt + smrng
lband = filt - smrng

// === PLOTTING ===
// Killer Coin V2 Plots
bullColor = color.new(#00ffbb, 50)
bearColor = color.new(#800080, 50)
fastPlot = plot(fastEMA, "Fast EMA", color = fastEMA > slowEMA ? bullColor : bearColor)
slowPlot = plot(slowEMA, "Slow EMA", color = fastEMA > slowEMA ? bullColor : bearColor)
fill(fastPlot, slowPlot, color = fastEMA > slowEMA ? bullColor : bearColor)

// Range Filter Plots
filtcolor = upward > 0 ? color.new(color.lime, 0) : downward > 0 ? color.new(color.red, 0) : color.new(color.orange, 0)
filtplot = plot(filt, "Range Filter", color=filtcolor, linewidth=3)
hbandplot = plot(hband, "High Target", color=color.new(color.aqua, 90))
lbandplot = plot(lband, "Low Target", color=color.new(color.fuchsia, 90))
fill(hbandplot, filtplot, color=color.new(color.aqua, 90))
fill(lbandplot, filtplot, color=color.new(color.fuchsia, 90))

// === STRATEGY CONDITIONS ===
// Range Filter Conditions
longCond = ((src > filt) and (src > src[1]) and (upward > 0)) or ((src > filt) and (src < src[1]) and (upward > 0))
shortCond = ((src < filt) and (src < src[1]) and (downward > 0)) or ((src < filt) and (src > src[1]) and (downward > 0))

CondIni = 0
CondIni := longCond ? 1 : shortCond ? -1 : CondIni[1]
longCondition = longCond and CondIni[1] == -1
shortCondition = shortCond and CondIni[1] == 1

// Combined Conditions
finalLongSignal = longCondition and fastEMA > slowEMA and window()
finalShortSignal = shortCondition and fastEMA < slowEMA and window()

// === PLOTTING SIGNALS ===
plotshape(finalLongSignal, "Buy Signal", text="BUY", textcolor=color.white, 
         style=shape.labelup, size=size.normal, location=location.belowbar, 
         color=color.new(color.green, 0))
         
plotshape(finalShortSignal, "Sell Signal", text="SELL", textcolor=color.white, 
         style=shape.labeldown, size=size.normal, location=location.abovebar, 
         color=color.new(color.red, 0))

// === STRATEGY ENTRIES ===
if finalLongSignal
    strategy.entry("Long", strategy.long, stop=hband)
    
if finalShortSignal
    strategy.entry("Short", strategy.short, stop=lband)

// === ALERTS ===
alertcondition(finalLongSignal, "Strong Buy Signal", "🚨 Buy - Both Indicators Aligned!")
alertcondition(finalShortSignal, "Strong Sell Signal", "🚨 Sell - Both Indicators Aligned!")