高度なトレンドフォローと適応型トレーリングストップ戦略

1
Follow
1781
Followers
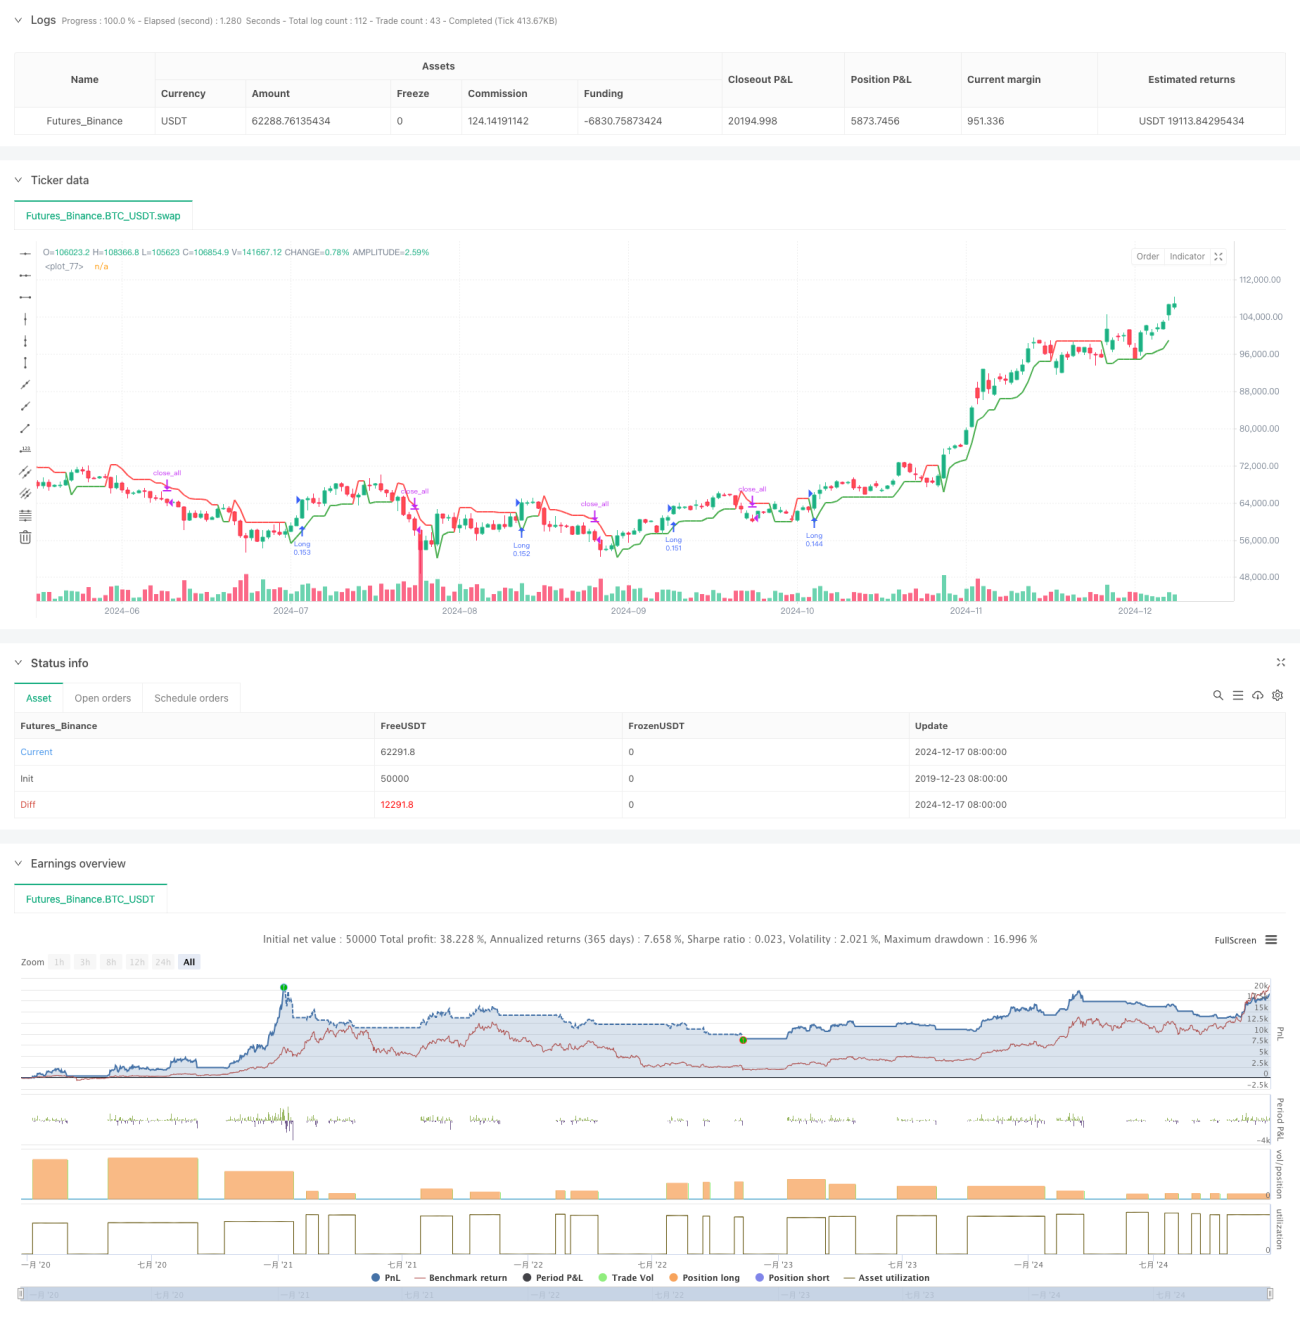
概要
これは,Supertrend指数に基づくトレンド追跡戦略で,自己適応の追跡ストップメカニズムを組み合わせている.この戦略は,主にSupertrend指数によって市場のトレンド方向を識別し,リスク管理と出場時間を最適化するために動的調整の追跡ストップを使用する.この戦略は,パーセントストップ,ATRストップ,固定ポイントストップを含む複数のストップ方法をサポートし,異なる市場環境に応じて柔軟に調整することができる.
戦略原則
戦略の中核となるロジックは、次の主要な要素に基づいています。
- Supertrend指標をトレンド判断の主要な根拠として使用し,ATR (平均リアル波幅) と組み合わせて市場の変動性を測定する
- 入場シグナルは,スーパートレンドの方向変化によって引き起こされ,多,空,または双方向取引をサポートします.
- ストップメカニズムは,市場波動に応じて自動的にストップ位置を調整できる自己適応的なトラッキングストップを採用しています.
- 取引管理システムにはポジション管理 (アカウントの15%のポジションをデフォルト) と時間フィルタリングの仕組みが含まれています.
戦略的優位性
- トレンドキャプター:スーパートレンド指標により,主要なトレンドを効果的に識別し,誤判を減らす
- リスク管理の完善: 多種多様な止損メカニズムにより,異なる市場環境に対応できる
- 柔軟性:複数の取引方向とストップモードをサポートする配置
- 適応性:トラッキングストップは市場の変動に合わせて自動的に調整され,戦略の適応性を高めます.
- 完全な反復システム: タイムフィルター機能が組み込まれ,履歴の分析が容易になります.
戦略リスク
- トレンド反転のリスク:波動の激しい市場では誤った信号が出る可能性がある
- スライドポイントリスク:市場流動性の影響によるストップ・トラックの実行
- パラメータ感性:スーパートレンドの要因とATR周期の設定が戦略のパフォーマンスに大きく影響する
- 市場環境依存: 変動する市場での取引の頻度がコストを増加させる可能性がある
戦略最適化の方向性
- 信号フィルタリングの最適化: 偽信号をフィルタリングするために追加の技術指標を追加できます.
- ポジション管理の最適化:市場の波動的な動向に応じてポジション保持比率を調整できる
- 損失防止機構の強化:コスト平均設計により複雑な損失防止論理を組み込むことができる
- 入場時の最適化:入場の精度を高めるために,価格構造分析を追加できます.
- 改善されたフィードバックシステム: 戦略のパフォーマンスを評価するためのより多くの指標を追加できます.
要約する
これは,合理的でリスクが制御可能なトレンド追跡戦略である.Supertrend指標と柔軟な止損機構を組み合わせることで,戦略は,高い収益性を維持しながら,リスクを効果的に制御することができる.戦略は,異なる市場環境で使用するのに適した配置性が強く,十分なパラメータの最適化と裏付けが必要である.将来的には,より多くの技術分析ツールとリスク制御手段を追加することで,戦略の安定性と収益性をさらに向上させることができる.
Source
Pine
/*backtest
start: 2019-12-23 08:00:00
end: 2024-12-18 08:00:00
period: 1d
basePeriod: 1d
exchanges: [{"eid":"Futures_Binance","currency":"BTC_USDT"}]
*/

//@version=6
strategy("Supertrend Strategy with Adjustable Trailing Stop [Bips]", overlay=true, default_qty_type=strategy.percent_of_equity, default_qty_value=15)

// InputsStrategy parameters
Related strategies
Comment
All comments (0)
No data
- 1