複数期間の流動性ハブヒートマップ定量戦略

1
Follow
1781
Followers
概要
この戦略は,複数の時間周期の流動性ハブポイント検出に基づいた定量取引システムである. それは,3つの異なる時間周期 ([15分,1時間,4時間) の価格行動を分析することによって,重要なサポートとレジスタンスレベルを識別し,その基礎で取引決定を行う. システムは,固定金額のストップ・ロスト設定を含む資金管理機能を統合し,同時に,直感的な視覚的フィードバックを提供し,トレーダーが市場構造をよりよく理解するのを助ける.
戦略原則
戦略の核心は,ta.pivothighとta.pivotlowの関数を使用して,複数の時間周期で価格のハブポイントを検出することです. 各時間周期に対して,システムは,左右参照のK線数 ((デフォルト7) を使って,顕著な高点と低点を決定します. 任意の時間周期で新しいハブポイントの低点が発生すると,システムは複数の信号を生成し,新しいハブポイントの高点が発生すると,システムは空の信号を生成します. 取引の実行は,固定金額のストップ・ローズ管理を採用し,moneyToSLPointsの関数でドル額を相応のポイントに変換します.
戦略的優位性
- マルチタイムサイクルの分析により,さまざまなレベルの取引機会を捉えるための,より包括的な市場見通しが得られます.
- ハブベースの取引ロジックは,理解し,実行しやすい,強力な技術分析の基礎を持っています.
- 統合された資金管理機能により,各取引のリスクを効果的に制御できます.
- 位置,ストップ・ストップ・損失レベル,利益の領域を含む取引状況を直視的に表示するビジュアルインタフェース
- 戦略のパラメータは調整可能で,適応性があり,異なる市場条件に応じて最適化できます.
戦略リスク
- 複数の時間周期の信号が衝突する可能性があるため,合理的な信号優先メカニズムを構築する必要がある.
- 固定金額のストップ・ロスは,すべての市場条件に適合しない可能性があり,波動的な動向に応じて調整することが推奨されます.
- ハブ検定の遅延により,入国時間が遅れる可能性があります.
- 激しい波動の間,偽の突破信号が発生する可能性があります.
- 異なる時間周期における流動性の違いに注意する
戦略最適化の方向性
- 波動率指標を導入し,ストップ・ストップ・損失レベルを動的に調整する
- 取引量確認メカニズムを追加し,ハブの信頼性を向上させる
- 信号の衝突を解決するタイムサイクル・プライオリティー・システムの開発
- トレンドフィルターを統合し,横軸市場での過剰取引を避ける
- 価格構造分析を追加し,入場時刻の精度を向上させる
要約する
多時周期流動性ノード熱力図量化戦略は,構造が整え,論理が明確である取引システムである.多次元的な市場分析と厳格なリスク管理により,トレーダーに信頼できる取引の枠組みを提供している.いくつかの固有のリスクと制限があるものの,継続的な最適化と改善により,この戦略は,さまざまな市場環境で安定したパフォーマンスを維持すると見込まれている.
Source
Pine
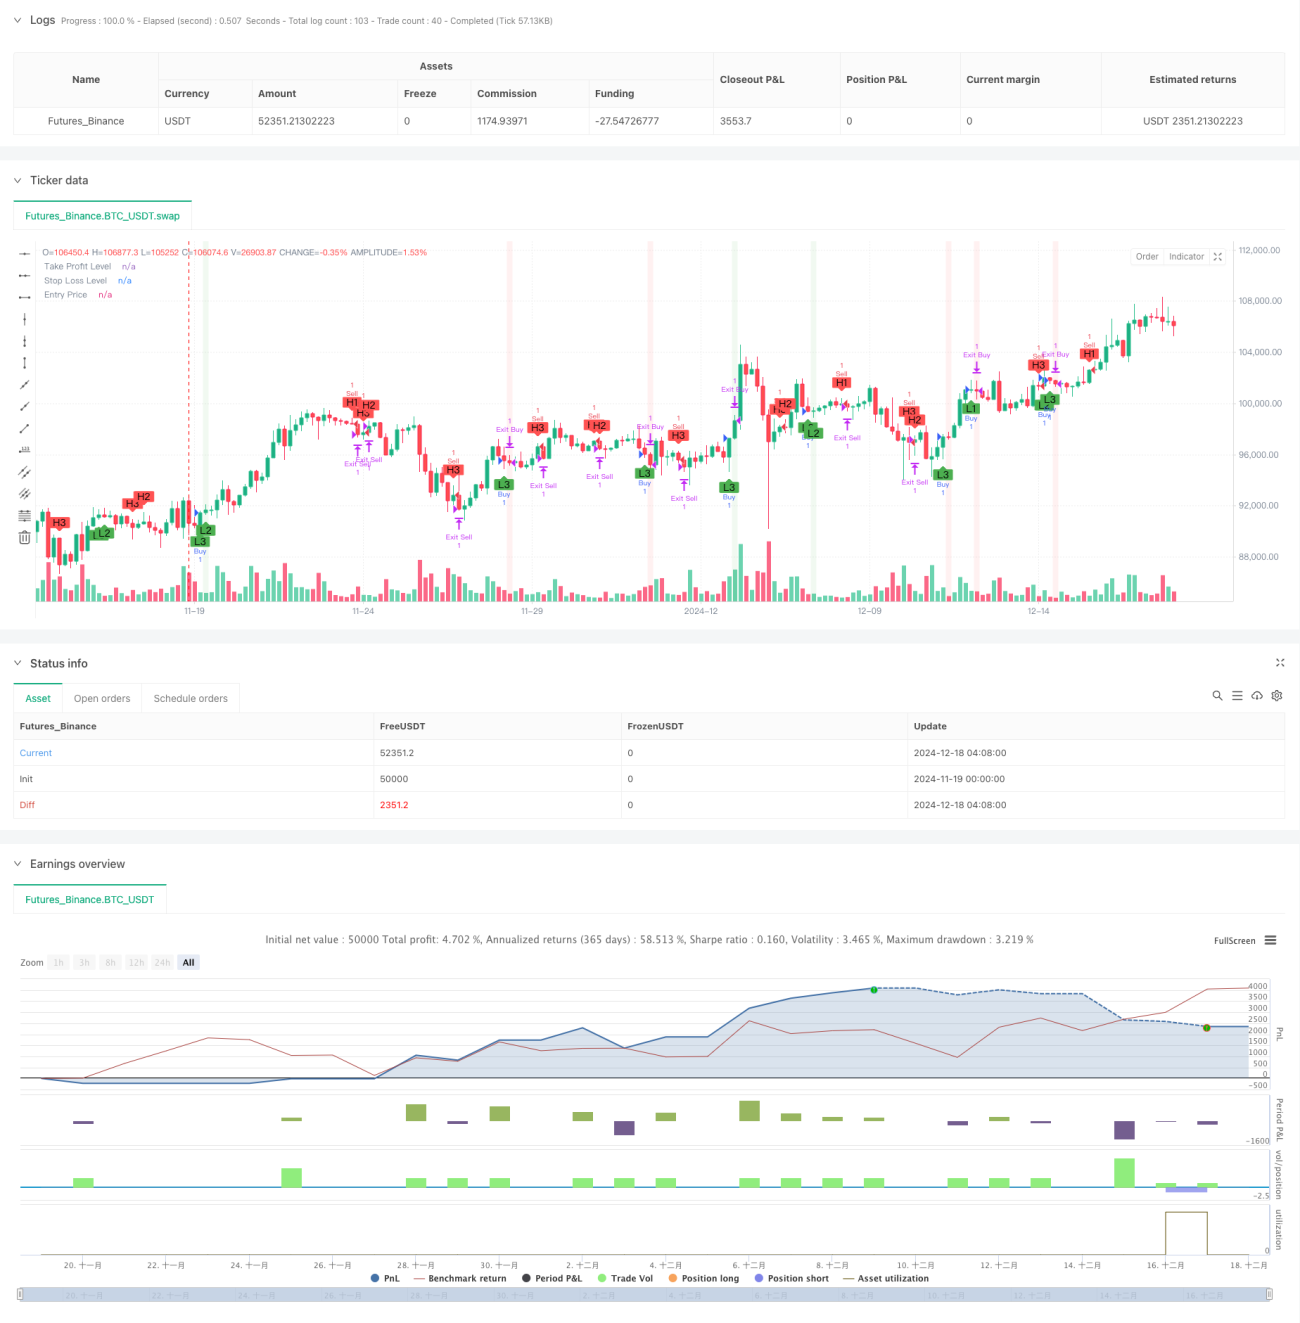
/*backtest
start: 2024-11-19 00:00:00
end: 2024-12-18 08:00:00
period: 4h
basePeriod: 4h
exchanges: [{"eid":"Futures_Binance","currency":"BTC_USDT"}]
*/

// This Pine Script™ code is subject to the terms of the Mozilla Public License 2.0 at https://mozilla.org/MPL/2.0/
// © pmotta41
//@version=5
strategy("GPT Session Liquidity Heatmap Strategy", overlay=true)Strategy parameters
Related strategies
Comment
All comments (0)
No data
- 1