
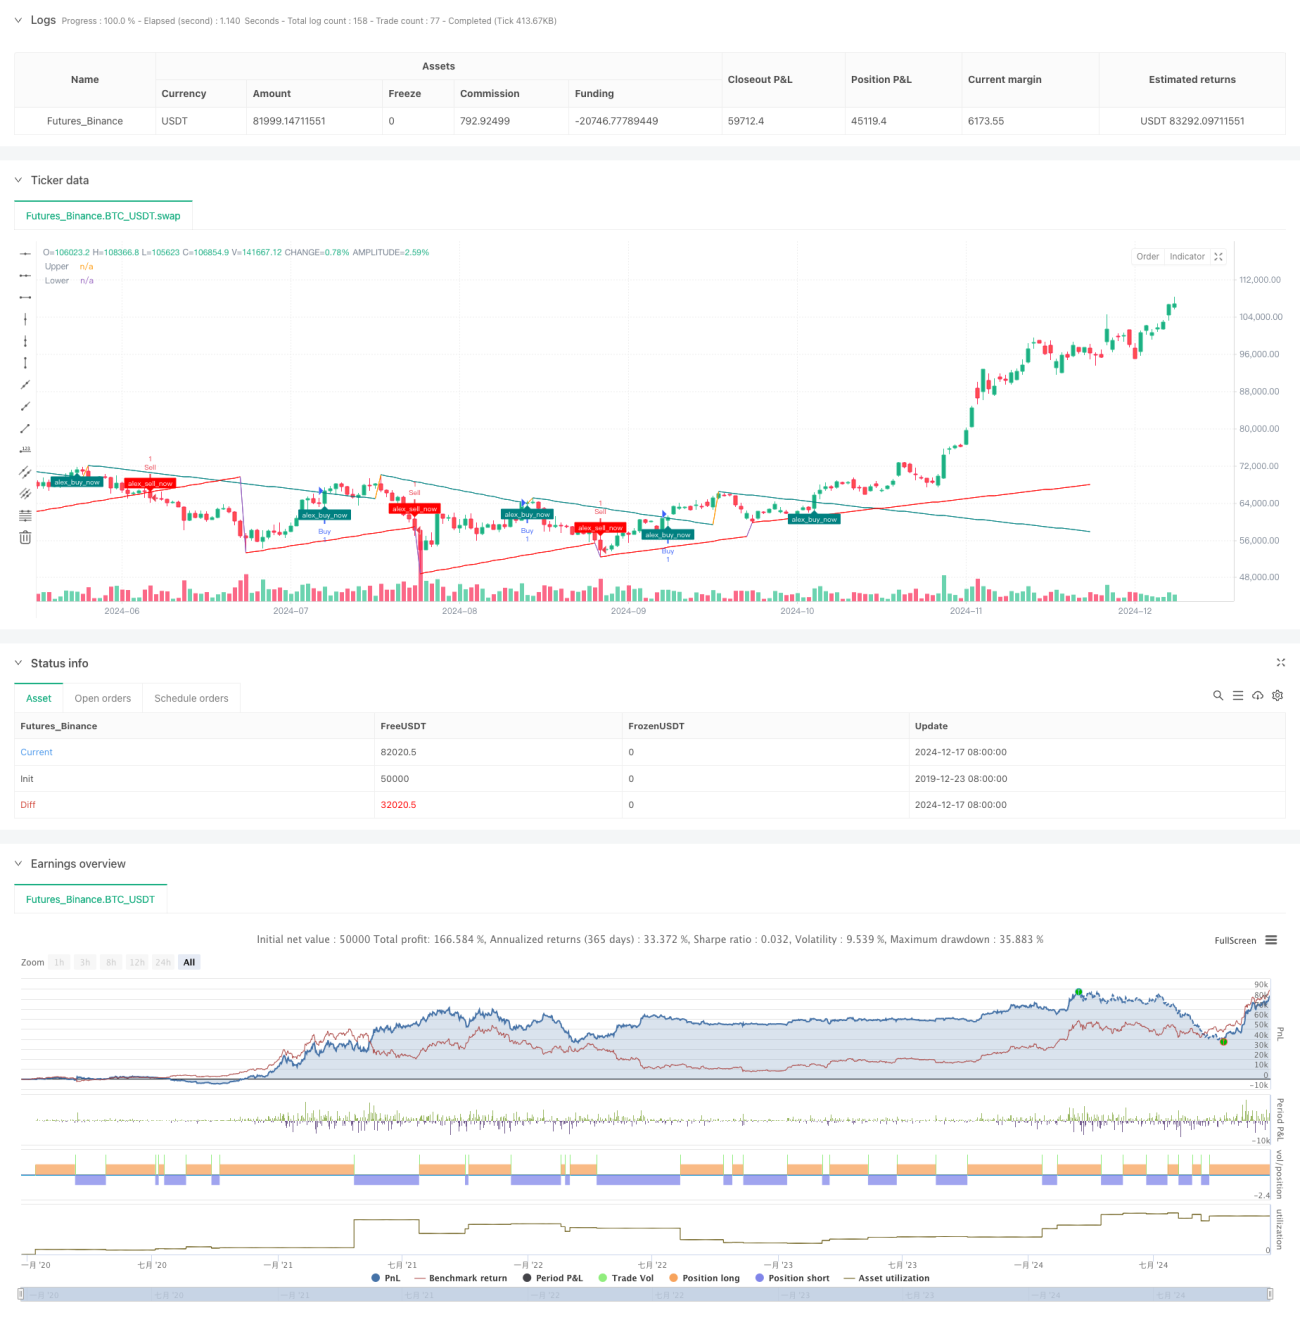
この戦略は,複数のトレンドラインの突破に基づいたスマートな取引システムである.これは,重要なサポートの抵抗点を動的に識別し,複数の技術指標と組み合わせてトレンドラインの斜率を計算し,価格がトレンドラインを突破したときに取引を行う.この戦略は,市場のトレンドの転換点を捕捉するだけでなく,パラメータの最適化によって異なる市場環境に対応することができます.
戦略の核心的な論理には,3つの主要な部分が含まれています. まず,最初のサポートレジスタンスとなる重要な高点と低点を,回帰期 (Lookback Period) によって識別します. 次に,選択された計算方法 (ATR,標準差,または線形回帰) に基づいて,トレンドラインの斜率を動的に計算し,トレンドラインを市場の波動により良く適応させます. 最後に,価格とトレンドラインの関係を監視し,突破が発生したときに取引シグナルを誘発します.
この戦略は,複数の技術分析方法の総合的な適用によって,信頼できるトレンドラインを突破する取引システムを構築している.その優点は,市場の変化に動的に適応し,明確な取引シグナルを提供することにある.いくつかの固有のリスクがあるものの,合理的なパラメータ設定と継続的な最適化により,戦略の安定性と収益性を大幅に向上させることができる.
/*backtest
start: 2019-12-23 08:00:00
end: 2024-12-18 08:00:00
period: 1d
basePeriod: 1d
exchanges: [{"eid":"Futures_Binance","currency":"BTC_USDT"}]
*/
// This Pine Script™ code is subject to the terms of the Mozilla Public License 2.0 at https://mozilla.org/MPL/2.0/
// © Alexgoldhunter
//@version=5
strategy("Trendlines with Breaks Strategy [AlexGoldHunter]", overlay=true)
// Input parameters
length = input.int(14, title="Swing Detection Lookback")
mult = input.float(1.0, title="Slope", minval=0, step=0.1)
calcMethod = input.string('Atr', title="Slope Calculation Method", options=['Atr','Stdev','Linreg'])
backpaint = input(true, tooltip='Backpainting offset displayed elements in the past. Disable backpainting to see real-time information returned by the indicator.')
// Style settings
upCss = input.color(color.teal, title="Up Trendline Color", group="Style")
dnCss = input.color(color.red, title="Down Trendline Color", group="Style")
showExt = input(true, title="Show Extended Lines")
// Calculations
var upper = 0.0
var lower = 0.0
var slope_ph = 0.0
var slope_pl = 0.0
var offset = backpaint ? length : 0
n = bar_index
src = close
ph = ta.pivothigh(length, length)
pl = ta.pivotlow(length, length)
// Slope Calculation Method
slope = switch calcMethod
'Atr' => ta.atr(length) / length * mult
'Stdev' => ta.stdev(src, length) / length * mult
'Linreg' => math.abs(ta.sma(src * n, length) - ta.sma(src, length) * ta.sma(n, length)) / ta.variance(n, length) / 2 * mult
// Get slopes and calculate trendlines
slope_ph := ph ? slope : slope_ph
slope_pl := pl ? slope : slope_pl
upper := ph ? ph : upper - slope_ph
lower := pl ? pl : lower + slope_pl
var upos = 0
var dnos = 0
upos := ph ? 0 : close > upper - slope_ph * length ? 1 : upos
dnos := pl ? 0 : close < lower + slope_pl * length ? 1 : dnos
// Extended Lines
// var uptl = line.new(na, na, na, na, color=upCss, style=line.style_dashed, extend=extend.right)
// var dntl = line.new(na, na, na, na, color=dnCss, style=line.style_dashed, extend=extend.right)
// if ph and showExt
// uptl.set_xy1(n - offset, backpaint ? ph : upper - slope_ph * length)
// uptl.set_xy2(n - offset + 1, backpaint ? ph - slope : upper - slope_ph * (length + 1))
// if pl and showExt
// dntl.set_xy1(n - offset, backpaint ? pl : lower + slope_pl * length)
// dntl.set_xy2(n - offset + 1, backpaint ? pl + slope : lower + slope_pl * (length + 1))
// Plots
plot(backpaint ? upper : upper - slope_ph * length, title="Upper", color=ph ? na : upCss, offset=-offset)
plot(backpaint ? lower : lower + slope_pl * length, title="Lower", color=pl ? na : dnCss, offset=-offset)
// Breakouts
plotshape(upos > upos[1] ? low : na, title="Upper Break",
style=shape.labelup, location=location.absolute, color=upCss, text="alex_buy_now", textcolor=color.white, size=size.tiny)
plotshape(dnos > dnos[1] ? high : na, title="Lower Break",
style=shape.labeldown, location=location.absolute, color=dnCss, text="alex_sell_now", textcolor=color.white, size=size.tiny)
// Strategy: Buy and Sell conditions
if (upos > upos[1])
strategy.entry("Buy", strategy.long)
if (dnos > dnos[1])
strategy.entry("Sell", strategy.short)
// Alerts
alertcondition(upos > upos[1], title="Upward Breakout", message="Price broke the down-trendline upward")
alertcondition(dnos > dnos[1], title="Downward Breakout", message="Price broke the up-trendline downward")