
1
Follow
1802
Followers
概要
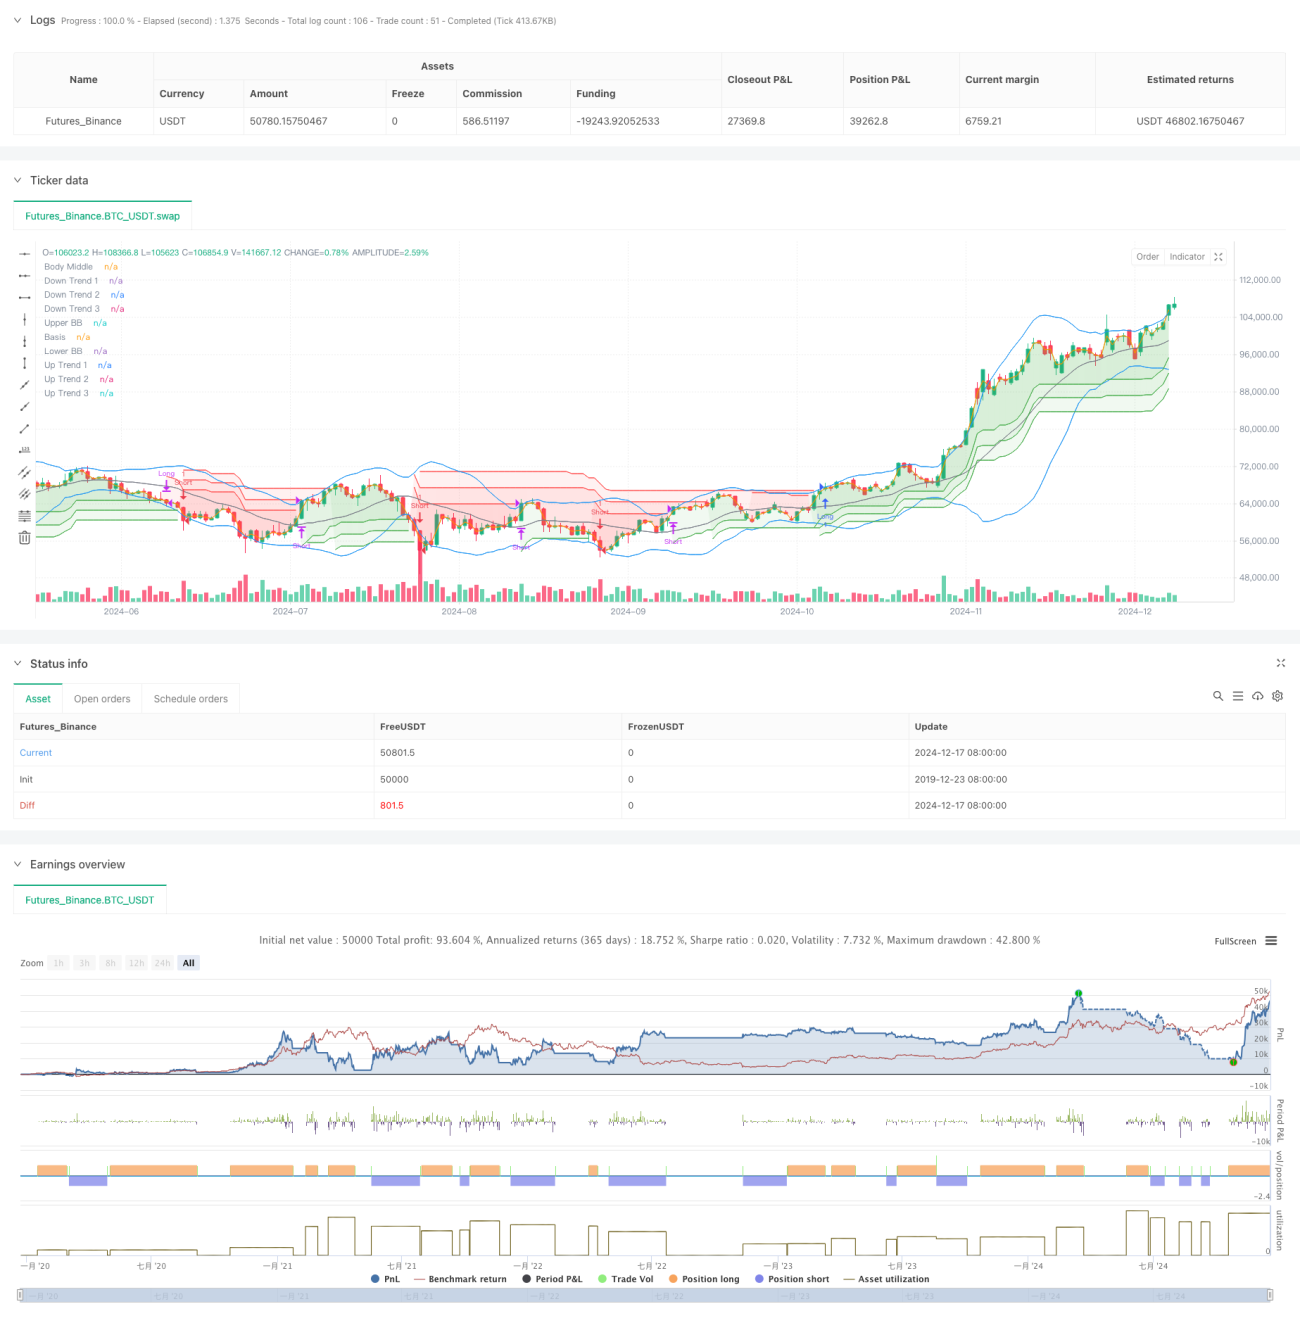
本戦略は、ボリンジャーバンドとトリプルスーパートレンドインジケーターを組み合わせた取引手法です。ボリンジャーバンドによるボラティリティの変動範囲の判断と、トリプルスーパートレンドによるトレンドの確認を組み合わせることで、堅牢なトレンドフォローシステムを構築しています。ボリンジャーバンドは価格の極端な変動を識別し、トリプルスーパートレンドは異なるパラメーター設定によるトレンド方向の多重確認を提供します。すべてのシグナルが一致した場合にのみ取引を行うことで、誤ったシグナルのリスクを低減します。この組み合わせ手法は、トレンドフォローの利点を維持しつつ、取引の信頼性を高めます。
戦略の原理
戦略の核心ロジックは、以下の主要な部分で構成されています。
- 20期間のボリンジャーバンドを使用し、標準偏差の倍率は2.0とし、価格変動を判断します。
- 3本のスーパートレンドラインを設定し、期間はそれぞれ10、パラメーターは3.0、4.0、5.0とします。
- ロングエントリー条件:価格がボリンジャーバンドの上限を突破し、かつ3本のスーパートレンドラインがすべて上昇トレンドを示すこと。
- ショートエントリー条件:価格がボリンジャーバンドの下限を下回り、かつ3本のスーパートレンドラインがすべて下降トレンドを示すこと。
- いずれかのスーパートレンドラインが方向転換した場合、現在のポジションを決済します。
- 中間価格線をフィル参考として使用し、視覚効果を高めます。
戦略のメリット
- 多重確認メカニズム:ボリンジャーバンドとトリプルスーパートレンドの組み合わせにより、誤ったシグナルを大幅に低減します。
- トレンドフォロー能力が高い:スーパートレンド指標の段階的なパラメーター設定により、異なるレベルのトレンドを効果的に捉えることができます。
- リスク管理が充実:トレンドに転換の兆候が見られた場合、速やかにポジションを決済し、ドローダウンを抑制します。
- パラメーター調整の柔軟性が高い:各指標のパラメーターは、市場の特性に応じて最適化が可能です。
- 自動化の度合いが高い:戦略ロジックが明確で、システム化の実装が容易です。
戦略のリスク
- レンジ相場のリスク:横ばいのレンジ相場では、誤ったブレイクアウトシグナルが頻発する可能性があります。
- スリッページの影響:激しい変動時には、大きなスリッページ損失に直面する可能性があります。
- 遅延リスク:多重確認メカニズムにより、エントリータイミングが遅れる可能性があります。
- パラメーター感応度:異なるパラメーターの組み合わせにより、戦略のパフォーマンスに大きな差が生じる可能性があります。
- 市場環境への依存:トレンドが明確な市場ではより良いパフォーマンスを示します。
戦略の最適化方向
- 出来高指標の導入:出来高による価格ブレイクアウトの有効性確認。
- ストップロスメカニズムの最適化:トレーリングストップやATRに基づく動的ストップロスの追加。
- 時間フィルターの追加:特定の時間帯の取引禁止により、非効率的な変動を回避。
- ボラティリティフィルターの追加:過度な変動時にポジション調整または取引停止。
- パラメーター適応メカニズムの開発:市場状態に応じてパラメーターを動的に調整。
まとめ
これは、ボリンジャーバンドとトリプルスーパートレンドを組み合わせたトレンドフォロー戦略であり、複数のテクニカル指標の確認により取引の信頼性を高めています。本戦略は、高いトレンド捕捉能力とリスク管理能力を備えていますが、市場環境がパフォーマンスに与える影響にも注意が必要です。継続的な最適化と改善により、様々な市場条件下でも安定したパフォーマンスを維持することが期待されます。実際の取引に使用する前に、十分なバックテストとパラメーター最適化を行い、市場の実情に合わせて適切に調整することを推奨します。
Source
Pine
//@version=5
strategy("Demo GPT - Bollinger + Triple Supertrend Combo", overlay=true, commission_type=strategy.commission.percent, commission_value=0.1, slippage=3)

// -------------------------------
// User Input for Date Range
// -------------------------------
startDate = input(title="Start Date", defval=timestamp("2018-01-01 00:00:00"))
endDate   = input(title="End Date",   defval=timestamp("2069-12-31 23:59:59"))

// -------------------------------
// Bollinger Band Inputs
// -------------------------------Strategy parameters
Comment
All comments (0)
No data
- 1