マルチインジケータートレンドフォローオプション取引EMAクロスオーバー戦略

EMA SMA VWAP MACD RSI TP
作成日: 2024-12-20 14:49:04 最終変更日: 2024-12-20 14:49:04
コピー: 2 クリック数: 432
1
フォロー
1617
フォロワー

マルチインジケータートレンドフォローオプション取引EMAクロスオーバー戦略

概要

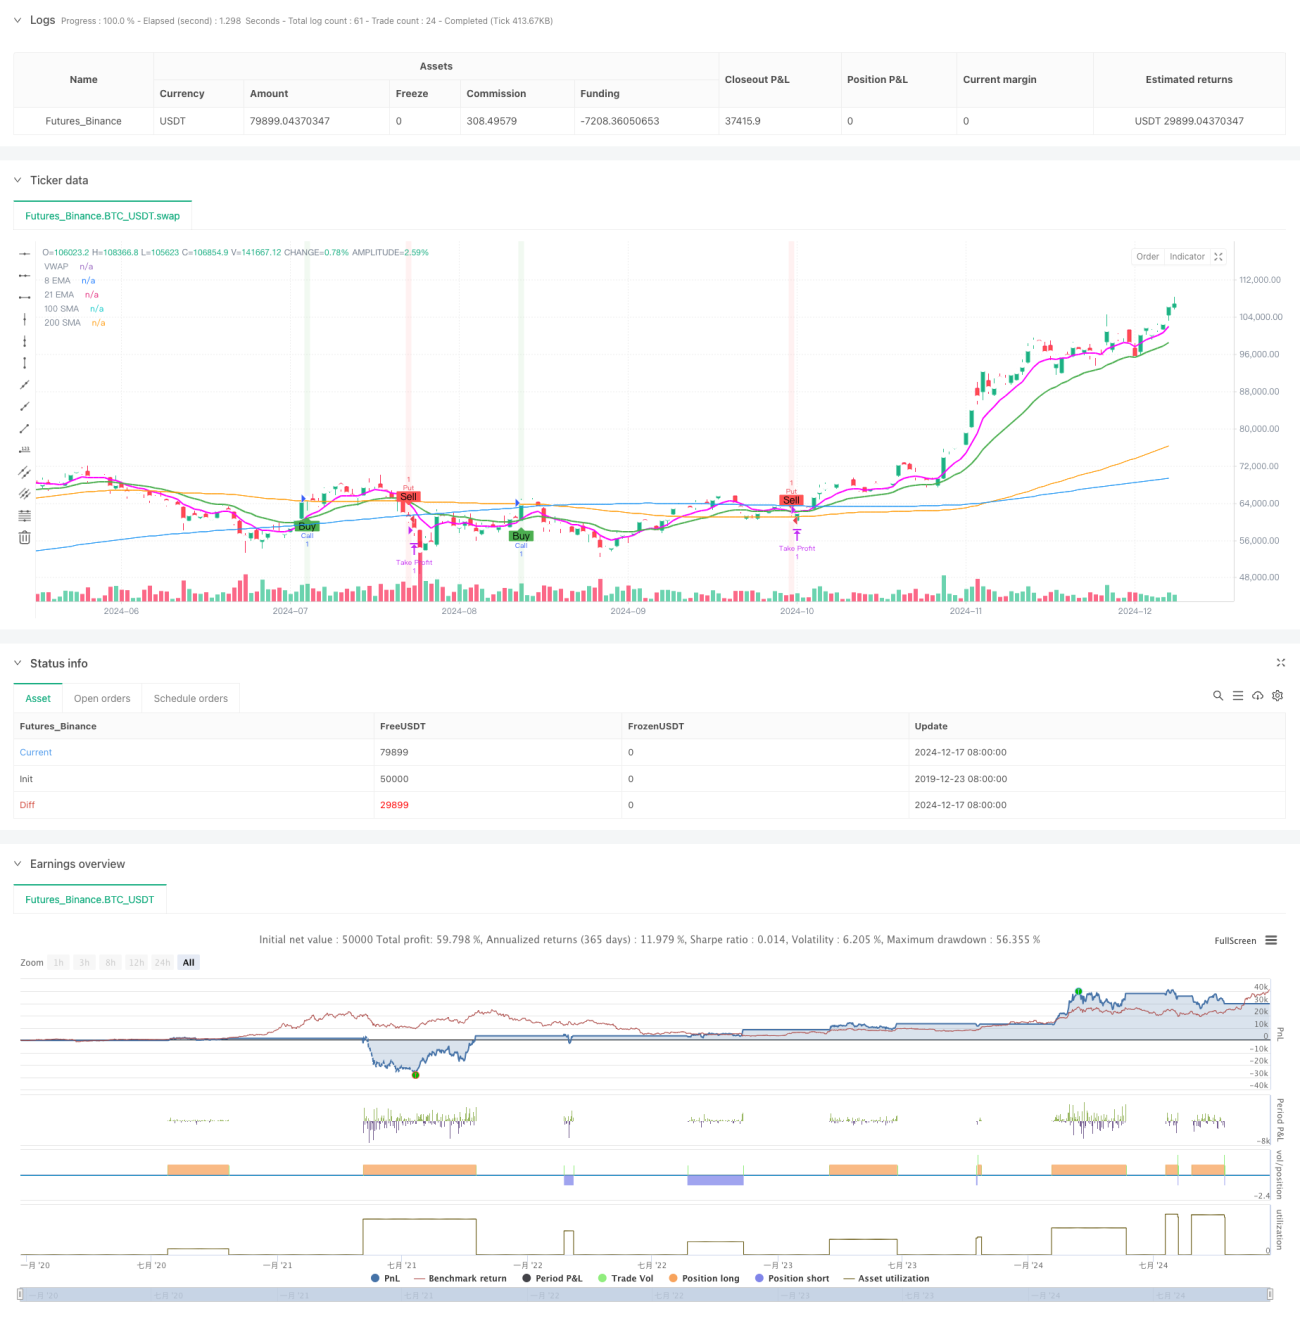
この戦略は,複数の技術指標の組み合わせに基づいたトレンドを追跡するオプション取引戦略である. 主にEMAの交差を核心信号として使用し,SMA,VWAPと組み合わせてトレンドの方向を確認し,MACDとRSIを補助指標として信号フィルタリングを行う. 戦略は,固定ストップポイントのリスク管理を採用し,厳格な入場条件と位置管理によって取引の成功率を向上させる.

戦略原則

策略は8サイクルと21サイクルEMAの交差を主要取引シグナルとして使用し,短期EMAに長期EMAを穿越し,以下の条件を満たすときに複数のシグナルをトリガーします:価格は100および200サイクルSMAの上にあり,MACD線はシグナル線の上にあり,RSIは50より大きい.空き信号のトリガ条件は逆である.策略は,現在の価格の相対的な位置を判断するのに役立つ価格重量参照としてVWAPを導入している.各取引は,取引量として固定1つの契約を使用し,5%のストップポイントを設定している.策略は,Openpositionの標識を使用してポジションの状態を追跡し,同時に1つのポジションしか持っていないことを保証する.

戦略的優位性

  1. 多指標の協調により,異なる周期とタイプの指標のクロス検証により,信号の信頼性を向上させる
  2. トレンドトラッキングと動態指標の組み合わせを使用して,トレンドを捉え,短期的な動態を観察します.
  3. 固定ストップポイントは,利潤を保護し,過度の貪欲を防ぐのに役立ちます.
  4. 厳格な保有管理により,重複開設を回避し,リスクの露出を減らす
  5. EMA,SMA,VWAPの動きと信号マークを含む,明確な視覚効果

戦略リスク

  1. 不安定な市場では誤ったシグナルが頻繁に発生する可能性がある
  2. 固定ストップポイントは,より大きな利益の機会を逃す可能性があります.
  3. ストップオフが設定されていないため,極端な状況では大きな損失を負う可能性があります.
  4. 複数の指標を使用すると,信号が遅れる可能性があります.
  5. 流動性の低いオプションの契約では,滑り場リスクが発生する可能性があります.

戦略最適化の方向性

  1. 市場変動の動向に合わせて適応的なストップ・ローズメカニズムを導入
  2. 取引量管理モジュールを追加し,アカウントサイズと市場状況に応じてポジションを動的に調整する
  3. 市場変動率のフィルターを追加し,高変動率の環境で戦略パラメータを調整する
  4. インジケーターのパラメータを最適化して,固定周期ではなく,自律周期を使用することを考慮する
  5. タイムフィルターを追加し,市場開盤と閉盤などの波動的な時期に取引を避ける

要約する

これは,構造が整った,論理が明確な多指標トレンド追跡オプション取引戦略である. 戦略は,複数の技術指標の協調的な配合によって取引信号の信頼性を高め,固定ストップポイント位置を使用してリスクを管理する. 戦略には,いくつかの固有のリスクがあるが,提案された最適化方向によって,戦略の安定性と収益性をさらに向上させることができる. 戦略の可視化設計は,トレーダーが取引信号を直感的に理解し,実行するのを助ける.

ストラテジーソースコード
/*backtest
start: 2019-12-23 08:00:00
end: 2024-12-18 08:00:00
period: 1d
basePeriod: 1d
exchanges: [{"eid":"Futures_Binance","currency":"BTC_USDT"}]
*/

//@version=5
strategy("OptionsMillionaire Strategy with Take Profit Only", overlay=true, default_qty_type=strategy.fixed, default_qty_value=1)

// Define custom magenta color
magenta = color.rgb(255, 0, 255)  // RGB for magenta

// Input settings for Moving Averages
ema8 = ta.ema(close, 8)
ema21 = ta.ema(close, 21)
sma100 = ta.sma(close, 100)
sma200 = ta.sma(close, 200)
vwap = ta.vwap(close)  // Fixed VWAP calculation

// Input settings for MACD and RSI
[macdLine, signalLine, _] = ta.macd(close, 12, 26, 9)
rsi = ta.rsi(close, 14)

// Define trend direction
isBullish = ema8 > ema21 and close > sma100 and close > sma200
isBearish = ema8 < ema21 and close < sma100 and close < sma200

// Buy (Call) Signal
callSignal = ta.crossover(ema8, ema21) and isBullish and macdLine > signalLine and rsi > 50

// Sell (Put) Signal
putSignal = ta.crossunder(ema8, ema21) and isBearish and macdLine < signalLine and rsi < 50

// Define Position Size and Take-Profit Level
positionSize = 1  // Position size set to 1 (each trade will use one contract)
takeProfitPercent = 5  // Take profit is 5%

// Variables to track entry price and whether the position is opened
var float entryPrice = na  // To store the entry price
var bool positionOpen = false  // To check if a position is open

// Backtesting Execution
if callSignal and not positionOpen
    // Enter long position (call)
    strategy.entry("Call", strategy.long, qty=positionSize)
    entryPrice := close  // Store the entry price
    positionOpen := true  // Set position as opened

if putSignal and not positionOpen
    // Enter short position (put)
    strategy.entry("Put", strategy.short, qty=positionSize)
    entryPrice := close  // Store the entry price
    positionOpen := true  // Set position as opened

// Only check for take profit after position is open
if positionOpen
    // Calculate take-profit level (5% above entry price for long, 5% below for short)
    takeProfitLevel = entryPrice * (1 + takeProfitPercent / 100)

    // Exit conditions (only take profit)
    if strategy.position_size > 0
        // Long position (call)
        if close >= takeProfitLevel
            strategy.exit("Take Profit", "Call", limit=takeProfitLevel)
    if strategy.position_size < 0
        // Short position (put)
        if close <= takeProfitLevel
            strategy.exit("Take Profit", "Put", limit=takeProfitLevel)

// Reset position when it is closed (this happens when an exit is triggered)
if strategy.position_size == 0
    positionOpen := false  // Reset positionOpen flag

// Plot EMAs
plot(ema8, color=magenta, linewidth=2, title="8 EMA")
plot(ema21, color=color.green, linewidth=2, title="21 EMA")

// Plot SMAs
plot(sma100, color=color.orange, linewidth=1, title="100 SMA")
plot(sma200, color=color.blue, linewidth=1, title="200 SMA")

// Plot VWAP
plot(vwap, color=color.white, style=plot.style_circles, title="VWAP")

// Highlight buy and sell zones
bgcolor(callSignal ? color.new(color.green, 90) : na, title="Call Signal Background")
bgcolor(putSignal ? color.new(color.red, 90) : na, title="Put Signal Background")

// Add buy and sell markers (buy below, sell above)
plotshape(series=callSignal, style=shape.labelup, location=location.belowbar, color=color.green, text="Buy", title="Call Signal Marker")
plotshape(series=putSignal, style=shape.labeldown, location=location.abovebar, color=color.red, text="Sell", title="Put Signal Marker")