マルチレベル下落ATHダイナミックトラッキング3段階購入戦略

ATH DCA
作成日: 2024-12-20 14:53:04 最終変更日: 2024-12-20 14:53:04
コピー: 0 クリック数: 372
1
フォロー
1617
フォロワー

マルチレベル下落ATHダイナミックトラッキング3段階購入戦略

概要

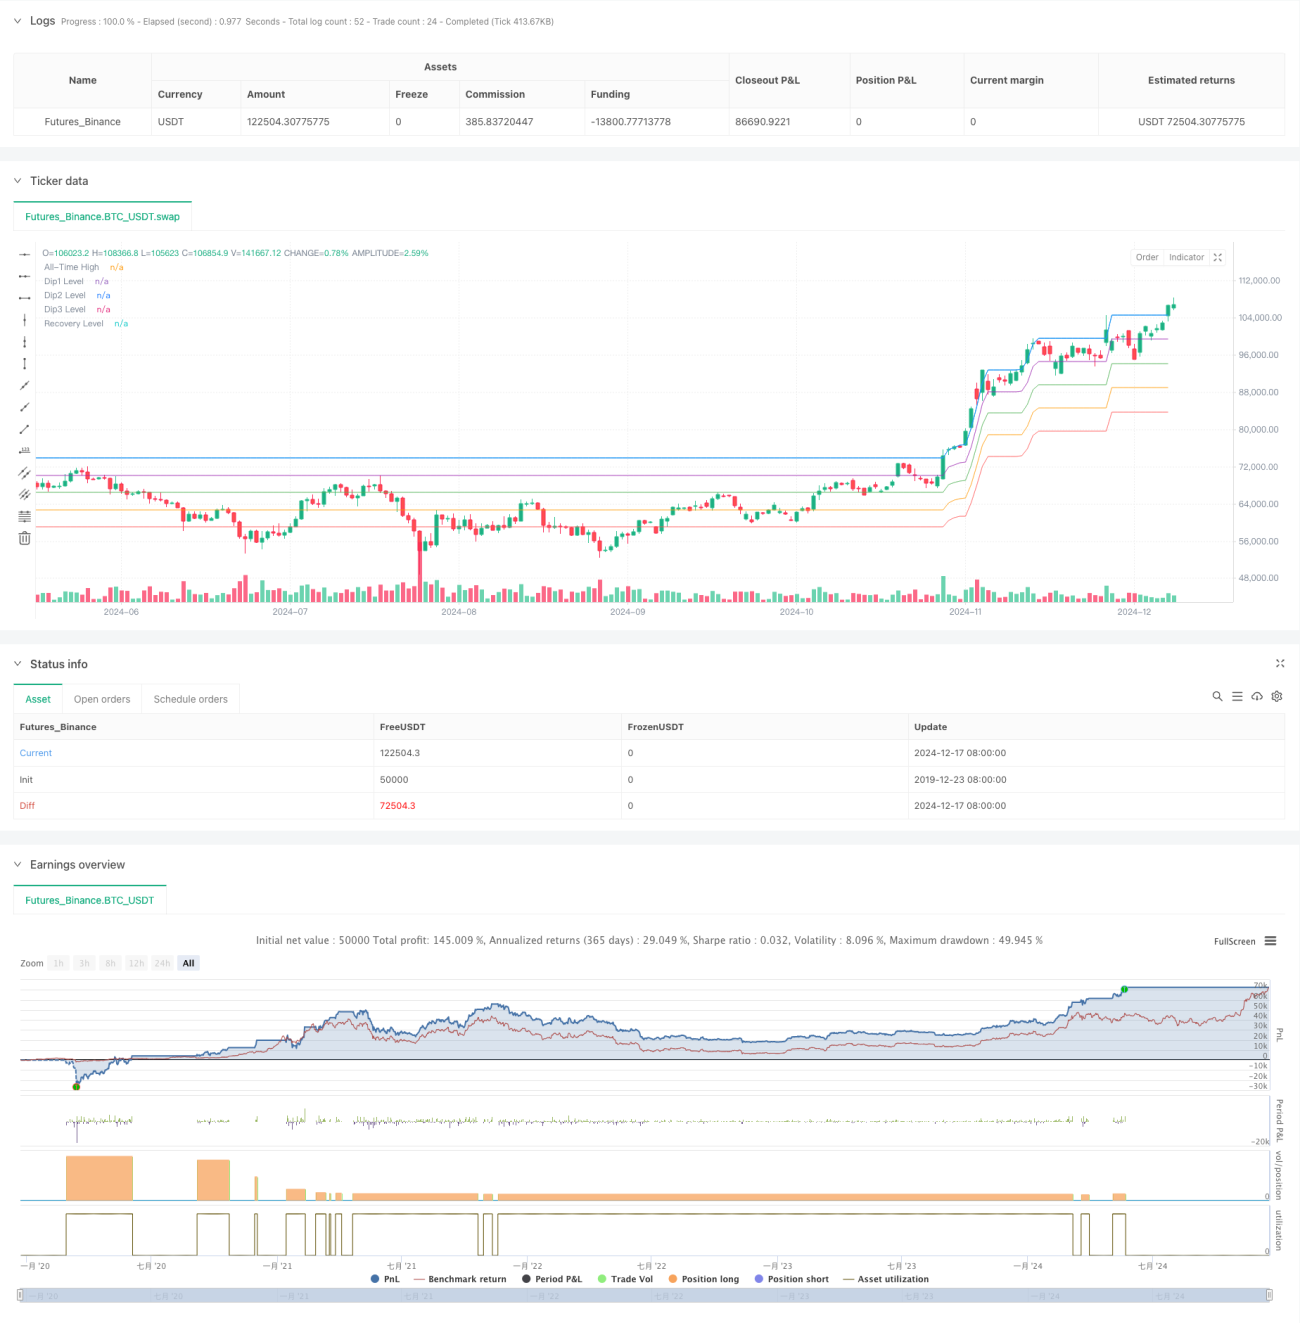
これは,歴史的な最高価格 (ATH) の動態を追跡した多層の買い戦略である.この戦略は,ATHからの引き下げ幅を監視し,異なる下落レベルで分量買い操作を実施し,価格がATHに近づくとすべて売り切って利益を得る.この戦略は,市場の変動性を充分に活用し,体系的な分量建置方法によって,全体の保有コストを削減する.

戦略原則

戦略の中核となるロジックには、次の重要な要素が含まれます。

  1. 動態ATHトラッキング:過去最高値の更新を継続し,新たな高値の突破時に買い札を再設定する
  2. 3級下落のトリガー:購入ポイントを10%,15%および20%の引き下げ位置に設定する
  3. 固定資金管理:購入ごとに同じ金額で購入する (($1000)
  4. 撤回平衡メカニズム:価格がATHの5%の範囲に回復すると,すべてのポジションを平衡する 戦略は,この漸進的なポジション構築方法によって,下落の過程で平均ポジションのコストを徐々に低下させ,市場が反発するときに,統一平仓によって利益をロックする.

戦略的優位性

  1. リスク分散: 貯蔵庫を分期して建設することで,時間点選択のリスクを低減
  2. コスト最適化: 平均保有コストを下げるため,より大きなリコールを利用する
  3. トレンド・トラッキング:動的更新 上昇傾向でATHの継続的な運用を保証する
  4. 資金効率性:固定資金の配分により,資金の使用の制御性が確保される
  5. 自動化実行:明瞭な出入場条件がシステム化操作を容易にする

戦略リスク

  1. トレンド反転のリスク:長期の下落傾向で連鎖が起こり得る
  2. 資金不足のリスク: 市場が激しく波動すると,資金が急に枯渇する可能性がある
  3. 機会を逃すリスク: 厳しい条件で良い機会を逃す
  4. 平仓のタイミングのリスク: 統一された平仓条件は,すべての市場環境に適応できない これらのリスクは,最大引出制限と総ポジションコントロールを設定することで管理することが推奨されます.

戦略最適化の方向性

  1. トレンドフィルターを導入:平均線または動量指標を追加して全体的なトレンドを確認する
  2. 資金管理の最適化:変動率の動向に合わせて,購入する資金の量
  3. 安定した平衡の改善:単一価格平衡のリスクを回避するために,分量平衡の選択肢を増やす
  4. ストップ・メカニズムの加入:最大リスクのコントロールのための絶対的なストップ・レベルを設定する
  5. ダイナミックパラメータ最適化:異なる市場サイクルに応じて自動的に購入グレードを調整

要約する

この戦略は,体系化された分期ポジション構築と統一平仓機構によって,市場の変動性をうまく利用している.戦略の成功の運行は,市場の十分な変動と最終的な上昇傾向を持つことに依存している.合理的なリスク制御とパラメータの最適化により,戦略は,異なる市場環境下で安定したパフォーマンスを維持することができる.

ストラテジーソースコード
/*backtest
start: 2019-12-23 08:00:00
end: 2024-12-18 08:00:00
period: 1d
basePeriod: 1d
exchanges: [{"eid":"Futures_Binance","currency":"BTC_USDT"}]
*/

// This Pine Script™ code is subject to the terms of the Mozilla Public License 2.0 at https://mozilla.org/MPL/2.0/
// © bsticks22

//@version=6

strategy("Long-term Bean Dip (v.1)", overlay=true)

// === Inputs ===
dip1 = input.float(10.0, "First Dip (%)", step=0.1)       // 10%
dip2 = input.float(15.0, "Second Dip (%)", step=0.1)      // 15%
dip3 = input.float(20.0, "Third Dip (%)", step=0.1)       // 20%
recovery_threshold = input.float(5.0, "Sell when within X% of ATH", step=0.1) // 5%
buy_amount = input.float(50000.0, "Buy Amount ($)", step=100) // $1000 increments

// === Variables ===
var float all_time_high = na
var bool dip1_bought = false
var bool dip2_bought = false
var bool dip3_bought = false

// === Update All-Time High ===
if na(all_time_high)
    all_time_high := high
else
    // Update ATH to the previous bar's high to exclude current bar's high
    all_time_high := math.max(all_time_high[1], high[1])
    if high[1] > all_time_high[1]
        // New ATH reached on the previous bar
        dip1_bought := false
        dip2_bought := false
        dip3_bought := false

// === Calculate Percentage Drop from ATH ===
percent_drop = (all_time_high - close) / all_time_high * 100.0

// === Define Dip Conditions ===
buyDip1 = (percent_drop >= dip1) and not dip1_bought
buyDip2 = (percent_drop >= dip2) and not dip2_bought
buyDip3 = (percent_drop >= dip3) and not dip3_bought

// === Calculate Quantity to Buy ===
qty1 = buy_amount / close

// === Execute Buys on Dips ===
if buyDip1
    strategy.entry("Dip1 Buy", strategy.long, qty=qty1)
    dip1_bought := true

if buyDip2
    strategy.entry("Dip2 Buy", strategy.long, qty=qty1)
    dip2_bought := true

if buyDip3
    strategy.entry("Dip3 Buy", strategy.long, qty=qty1)
    dip3_bought := true

// === Sell Condition: Recovery to Within X% of ATH ===
sell_condition = close >= all_time_high * (1 - recovery_threshold / 100.0)

// === Execute Sell on Recovery ===
if sell_condition and strategy.position_size > 0
    strategy.close_all()

// === Plotting ===
plot(all_time_high, title="All-Time High", color=color.new(color.blue, 0))
plot(all_time_high * (1 - dip1 / 100.0), title="Dip1 Level", color=color.new(color.green, 50), style=plot.style_linebr)
plot(all_time_high * (1 - dip2 / 100.0), title="Dip2 Level", color=color.new(color.orange, 50), style=plot.style_linebr)
plot(all_time_high * (1 - dip3 / 100.0), title="Dip3 Level", color=color.new(color.red, 50), style=plot.style_linebr)
plot(all_time_high * (1 - recovery_threshold / 100.0), title="Recovery Level", color=color.new(color.purple, 50), style=plot.style_linebr)

// === Plot Buy and Sell Signals ===
plotshape(buyDip1, title="Dip1 Buy", location=location.belowbar, color=color.green, style=shape.labelup, text="Buy10%")
plotshape(buyDip2, title="Dip2 Buy", location=location.belowbar, color=color.orange, style=shape.labelup, text="Buy15%")
plotshape(buyDip3, title="Dip3 Buy", location=location.belowbar, color=color.red, style=shape.labelup, text="Buy20%")
plotshape(sell_condition and strategy.position_size > 0, title="Sell", location=location.abovebar, color=color.purple, style=shape.labeldown, text="Sell")

// === Alerts ===
alertcondition(buyDip1, title="Dip1 Buy", message="Price dipped 10% from ATH, buying $1000")
alertcondition(buyDip2, title="Dip2 Buy", message="Price dipped 15% from ATH, buying $1000")
alertcondition(buyDip3, title="Dip3 Buy", message="Price dipped 20% from ATH, buying $1000")
alertcondition(sell_condition and strategy.position_size > 0, title="Sell at Recovery", message="Price recovered to within 5% of ATH, selling all")