1
フォロー
1750
フォロワー
概要
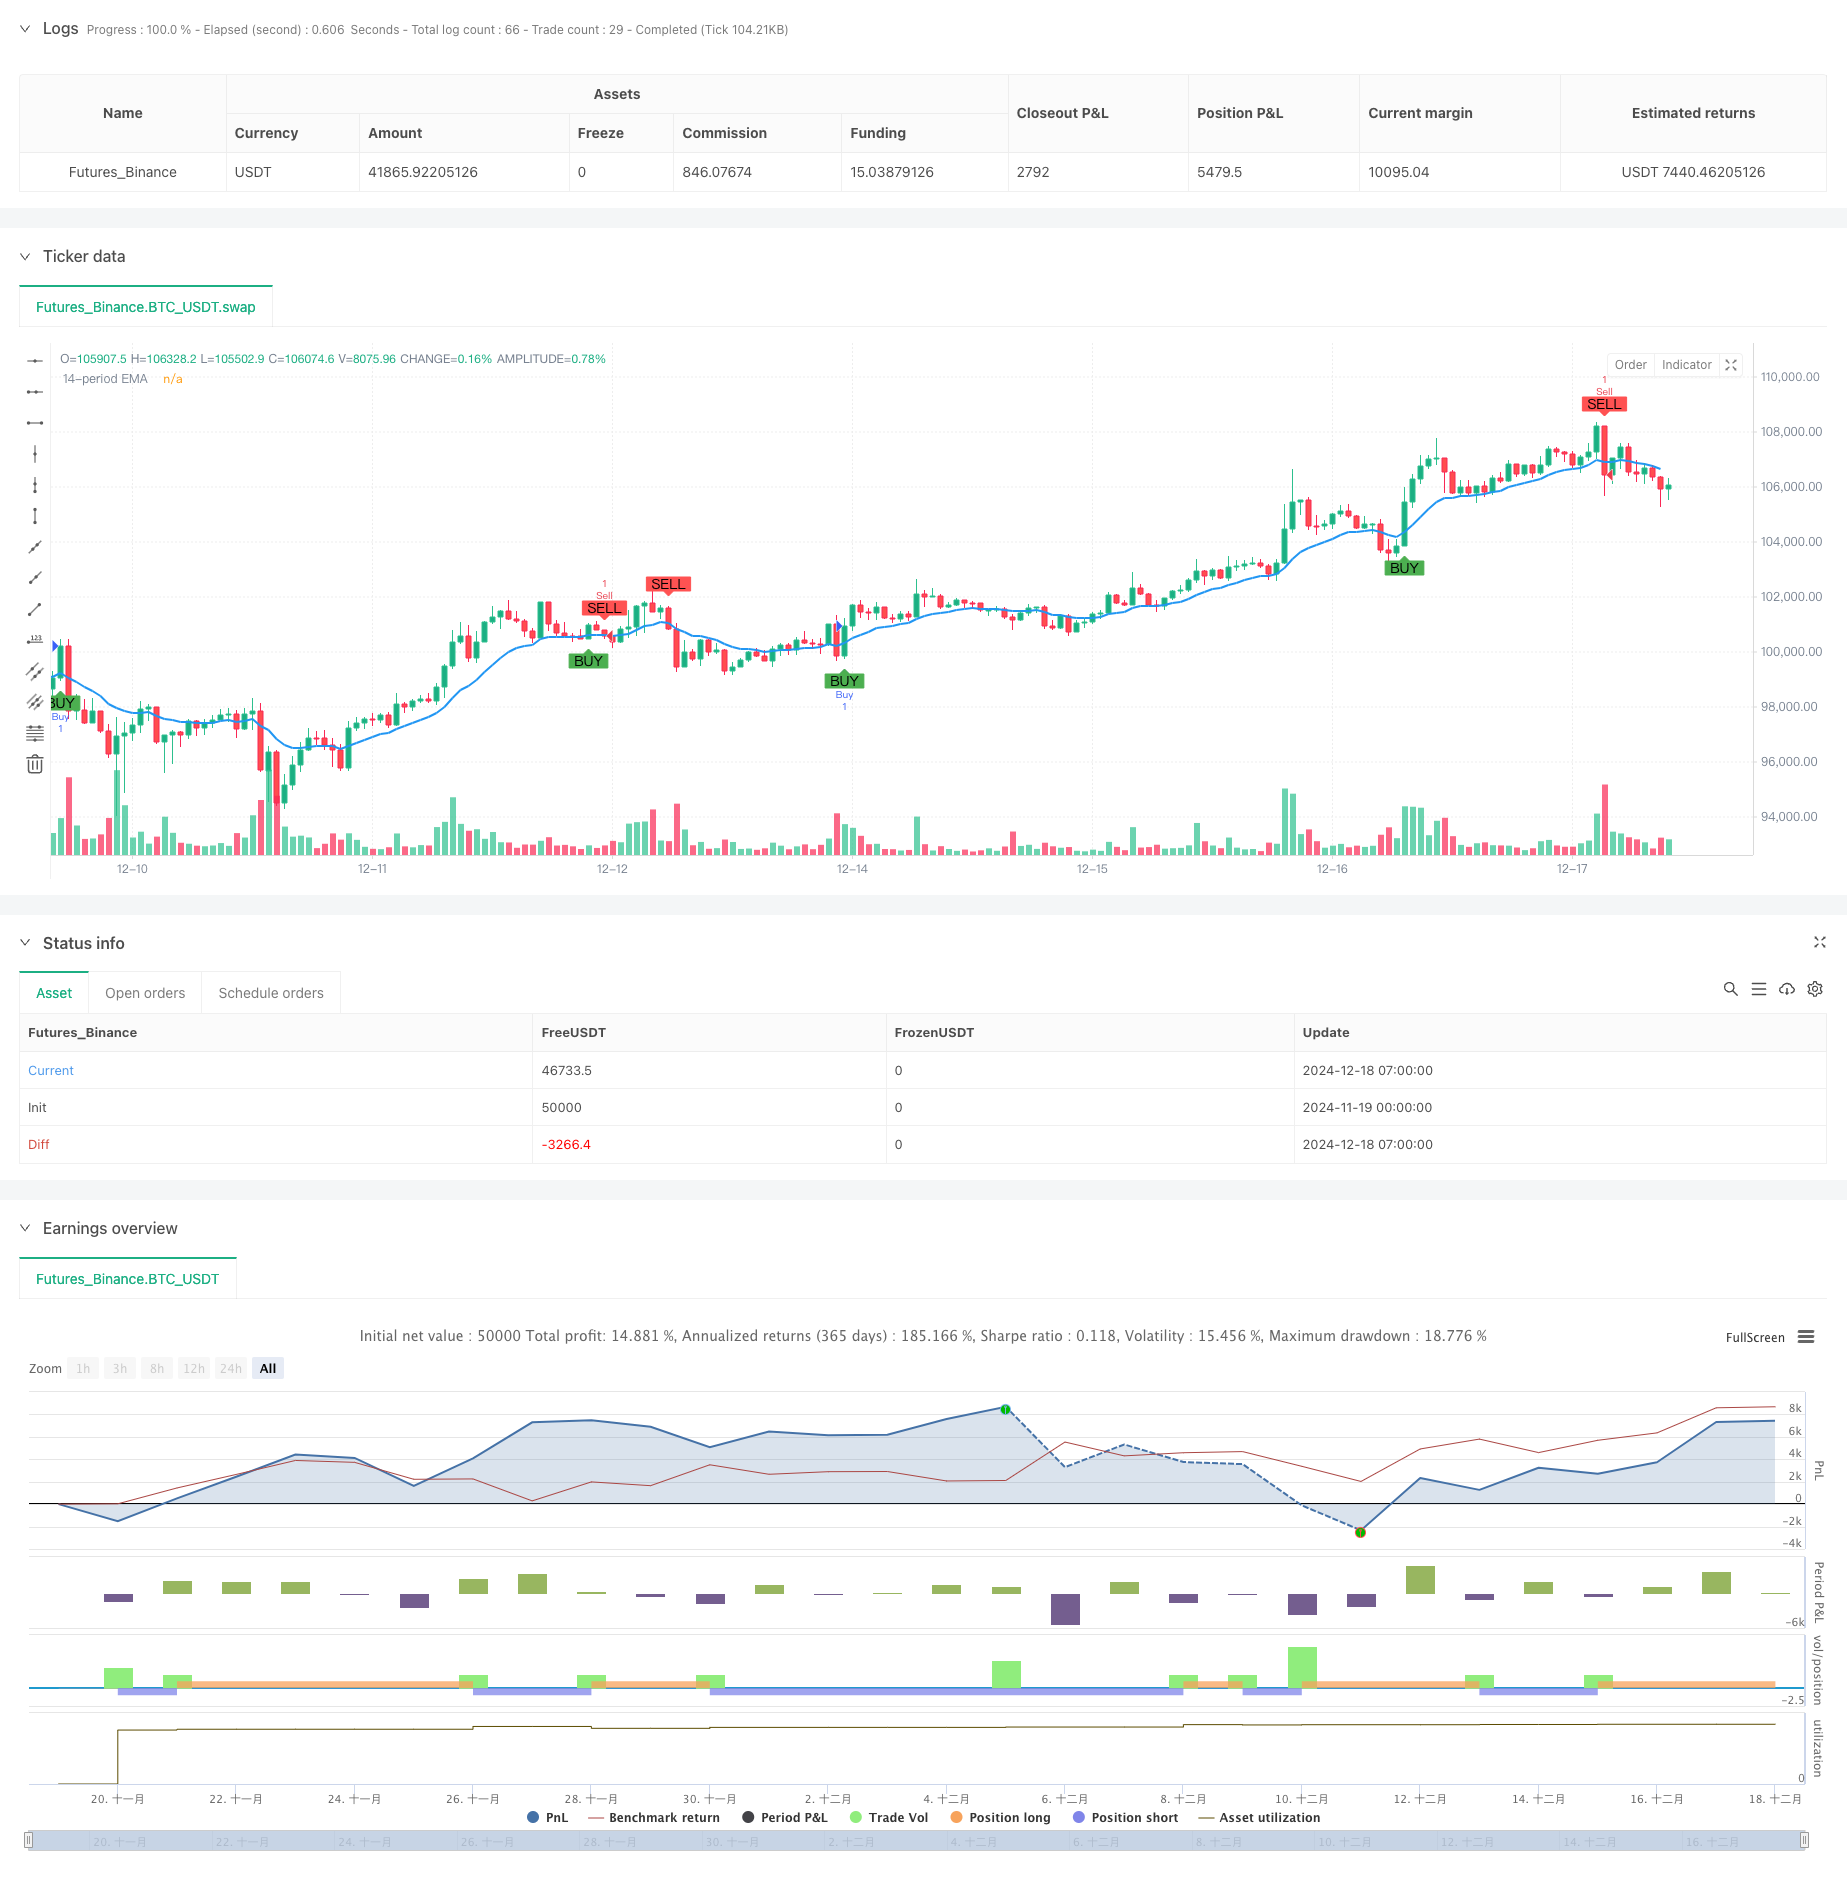
この戦略は,14周期指数移動平均 ((EMA) に基づく取引システムで,図形状分析と価格動量特性を組み合わせている.この戦略は,価格とEMAの交差関係を分析し,また図の形状特性を考慮しながら ((実体対影線比など) 取引信号を決定し,市場動向の変化点を捕捉する.
戦略原則
戦略の中核となるロジックは、次の主要な要素に基づいています。
- EMA突破確認: 14サイクルEMAを動的サポートとレジスタンス位置として使用.
- グラフの形状分析:
- 購入条件は,が陽線であることを要求する (閉店価格が開店価格より高い)
- 売却条件は, (閉店価格が開店価格より低い)
- 価格のチェック:
- 購入時に少なくとも50%のがEMAを通過することを要求する
- EMAを完全に破る必要があります.
- シェードラインの比例制御:
- 購入信号は,上下影線の合計がの総長さの40%を超えないことを要求する
- 信号の販売制限は,シャドウラインの総長さの20%を超えない.
戦略的優位性
- 厳格な信号品質管理:複数の条件の検証により,偽突破のリスクを低減する
- 形状認識精度:図実体と影線の比率分析を組み合わせ,信号信頼性を向上させる
- トレンド追跡能力:EMAのダイナミックな特性により,市場トレンドを効果的に追跡できます.
- リスク管理の改善:厳格なシャドライン比率管理により,取引リスクを低減する
- 適応性:戦略のパラメータは,異なる市場条件に応じて柔軟に調整できます.
戦略リスク
- 横軸市場リスク: 波動的な市場では頻繁に偽信号が生じる可能性がある
- 遅滞のリスク:EMA指数はそれ自体には遅滞があり,最適な入場点を逃す可能性がある
- ギャップリスク:大空飛ぶと止損効果が低下する
- パラメータの感受性: 戦略の有効性を維持するために,異なる市場環境でパラメータを調整する必要がある
戦略最適化の方向性
- 波動率のフィルタを導入する.
- 市場変動を評価するATR指標を追加
- 高波動期に信号確認のスレッジを上げること
- 多周期検証:
- 複数のタイムサイクルを増やす傾向が確認
- 多周期信号一致性検証機構の構築
- 動的パラメータ最適化:
- 市場変動に応じて動的に調整するEMAサイクル
- 影線の比率の値を自律的に調整する
- ポジション管理の最適化:
- 市場変動に基づいて設計されたダイナミックポジションシステム
- ピラミッド加減の導入
要約する
この戦略は,EMA,グラフ形状,価格行動分析を総合的に適用することで,完全な取引システムを構築している.戦略の優点は,信号確認の厳密さとリスク管理の完善性にあるが,市場環境が戦略のパフォーマンスに与える影響にも注意する必要がある.推奨された最適化方向によって,戦略の安定性と適応性がさらに向上する見込みがある.
ストラテジーソースコード
/*backtest
start: 2024-11-19 00:00:00
end: 2024-12-18 08:00:00
period: 1h
basePeriod: 1h
exchanges: [{"eid":"Futures_Binance","currency":"BTC_USDT"}]
*/

//@version=6
strategy("Buy and Sell Signals with EMA", overlay=true)

// Define the 14-period EMA
ema14 = ta.ema(close, 14)

// --- Buy Conditions ---
ema_length = input.int(14, title="EMA Length")

// Calculate the 14 EMA
ema_14 = ta.ema(close, ema_length)

// Calculate the candle body and wicks
body = close - open
upper_wick = high - close
lower_wick = open - low
total_candle_length = high - low

// Define the condition for the candle to be green (bullish)
is_green_candle = close > open

// Condition for crossing the 14 EMA (previous close was below, current close is above)
crossing_ema = ta.crossover(close, ema_14)

// Condition for at least 50% of the candle's body crossing the 14 EMA
body_crossed_ema = (close - open) * 0.5 <= (close - ema_14) and close > ema_14

// Condition for wick percent being less than or equal to 40% of the total candle length
wick_percent = (upper_wick + lower_wick) / total_candle_length
valid_wick_condition = wick_percent <= 0.4

// Define the buy condition
buy_condition = is_green_candle and crossing_ema and body_crossed_ema and valid_wick_condition

// --- Sell Conditions ---
candleIsRed = close < open
priceBelowEMA = close < ema14
prevLowAboveEMA = low[1] > ema14[1]  // Previous candle's low must be above the EMA
wickTooLarge = (low - math.min(open, close)) / (high - low) <= 0.2  // Lower wick should not exceed 20%

// Sell signal condition
sellSignal = priceBelowEMA and candleIsRed and prevLowAboveEMA and wickTooLarge

// --- Plotting ---
plot(ema14, color=color.blue, linewidth=2, title="14-period EMA") // Plot the 14-period EMA

// Plot the buy signal as an arrow on the chart
plotshape(buy_condition, color=color.green, style=shape.labelup, location=location.belowbar, text="BUY")

// Plot the sell signal as an arrow on the chart
plotshape(sellSignal, location=location.abovebar, color=color.red, style=shape.labeldown, title="Sell Signal", text="SELL")

// Optional: Add strategies for backtesting
if (buy_condition)
    strategy.entry("Buy", strategy.long)

if (sellSignal)
    strategy.entry("Sell", strategy.short)