ダイナミックトラッキング波トレンド戦略

1
Follow
1781
Followers
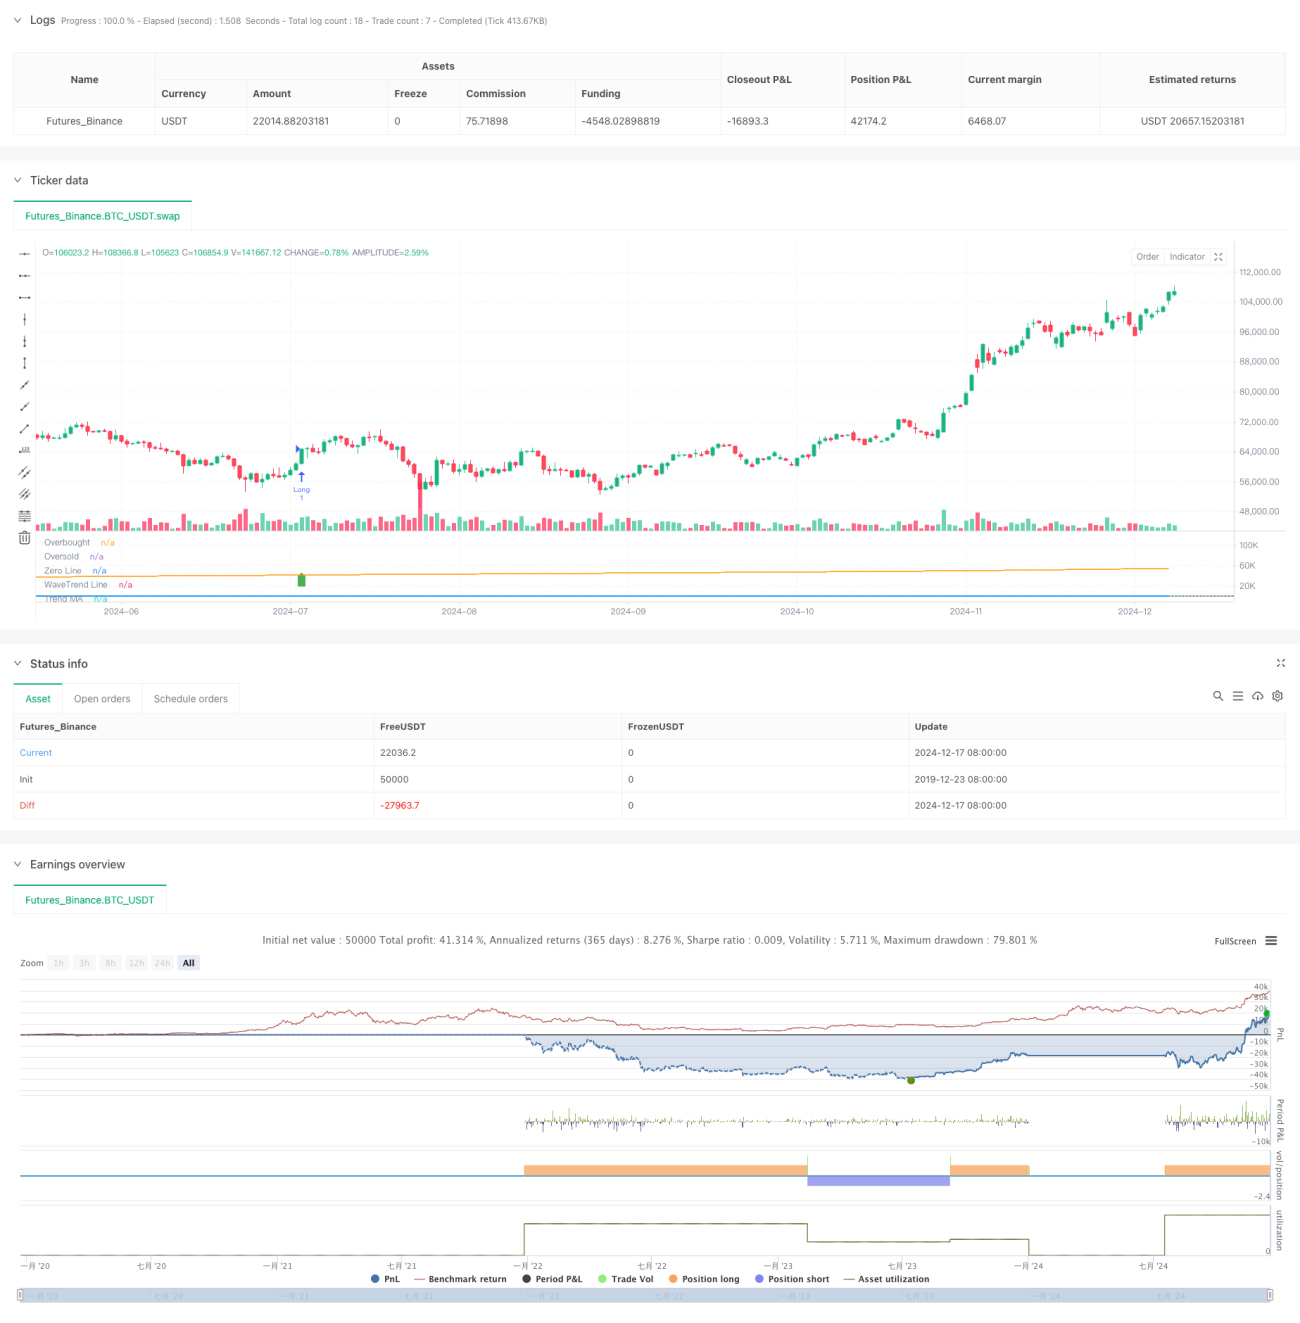
概要
この戦略は,WaveTrend指標とトレンド追跡に基づいた定量取引システムである. WaveTrend指標と移動平均を組み合わせることで,完全な取引意思決定の枠組みを形成する. 戦略は,EMAとSMAを使用して,波浪のトレンド値と市場の全体的なトレンドを計算し,超買い超売り<unk>値を設定することにより,市場の転換点を識別し,トレンドフィルターと組み合わせて取引の正確性を向上させる.
戦略原則
戦略の核心は以下のステップを踏まえて実現する:
- まず,HLC平均値 (最高値,最低値,終値の平均値) を計算します.
- HLCの平均値をEMAで平滑処理すると,ESA線が得られる.
- HLC平均値とESA線との差を計算し,EMAを使用して平滑化
- 偏差に基づいてK値を計算し,2回EMAを平らめることで最終的なTCI線が得られる
- 長期トレンドラインをトレンドフィルターとしてSMAで計算する
- TCIラインが超買超売のレベルを突破し,トレンドの方向に合致すると,取引シグナルが生成されます.
戦略的優位性
- 信号の信頼性: 偽信号を効率的に低減するために,WaveTrend指標とトレンドフィルターを組み合わせる
- リスク管理が完ぺき: 明確な超買超売の<unk>値が設定され,時効的な止損を助ける
- 適応性:戦略のパラメータは,異なる市場条件に柔軟に調整できます
- 操作論理の明晰さ:入場・出場条件が明確で実行が容易である
- 総合分析:短期的な変動と長期的傾向を考慮し,取引の安定性を向上させる
戦略リスク
- トレンド反転のリスク:激しい波動の中,後退の可能性
- パラメータの感度: 異なるパラメータの組み合わせによって、まったく異なる結果が生じる可能性があります。
- 市場の適応性: 変動する市場では頻繁に取引が起こりうる
- 資金管理:市場の波動に対応するためにポジションを合理的に管理する
- テクノロジー依存:技術依存指数は基本的な要素を無視する
戦略最適化の方向性
- 波動性フィルターを追加:高波動性期間の取引の<unk>値調整
- 多周期分析の導入:異なる時間周期を組み合わせた信号の精度向上
- オプティマイゼーションパラメータの自己適応:市場の状況に応じて指標パラメータの動的調整
- ストップ・ストップ・損失の改善: ダイナミックなストップ・ストップ・損失の増強
- 交差量確認を追加:交差量分析を組み合わせて信号信頼性を向上させる
要約する
この戦略は,WaveTrend指標とトレンドフィルターを巧妙に組み合わせて,堅牢な取引システムを構築しています.戦略は,操作の簡素性を保ちながら,市場に関する全面的な分析を実現しています.一定のリスクがあるものの,合理的なリスク管理と継続的な最適化により,この戦略は,優れた実用価値と発展の可能性を持っています.
Source
Pine
Strategy parameters
Related strategies
Comment
All comments (0)
No data
- 1