波動トレンドと分散投資に基づくインテリジェントサイクル取引戦略

WT DCA AO ESA EMA SMA CI VOL
作成日: 2024-12-20 16:42:45 最終変更日: 2024-12-20 16:42:45
コピー: 0 クリック数: 473
1
フォロー
1617
フォロワー

波動トレンドと分散投資に基づくインテリジェントサイクル取引戦略

戦略概要

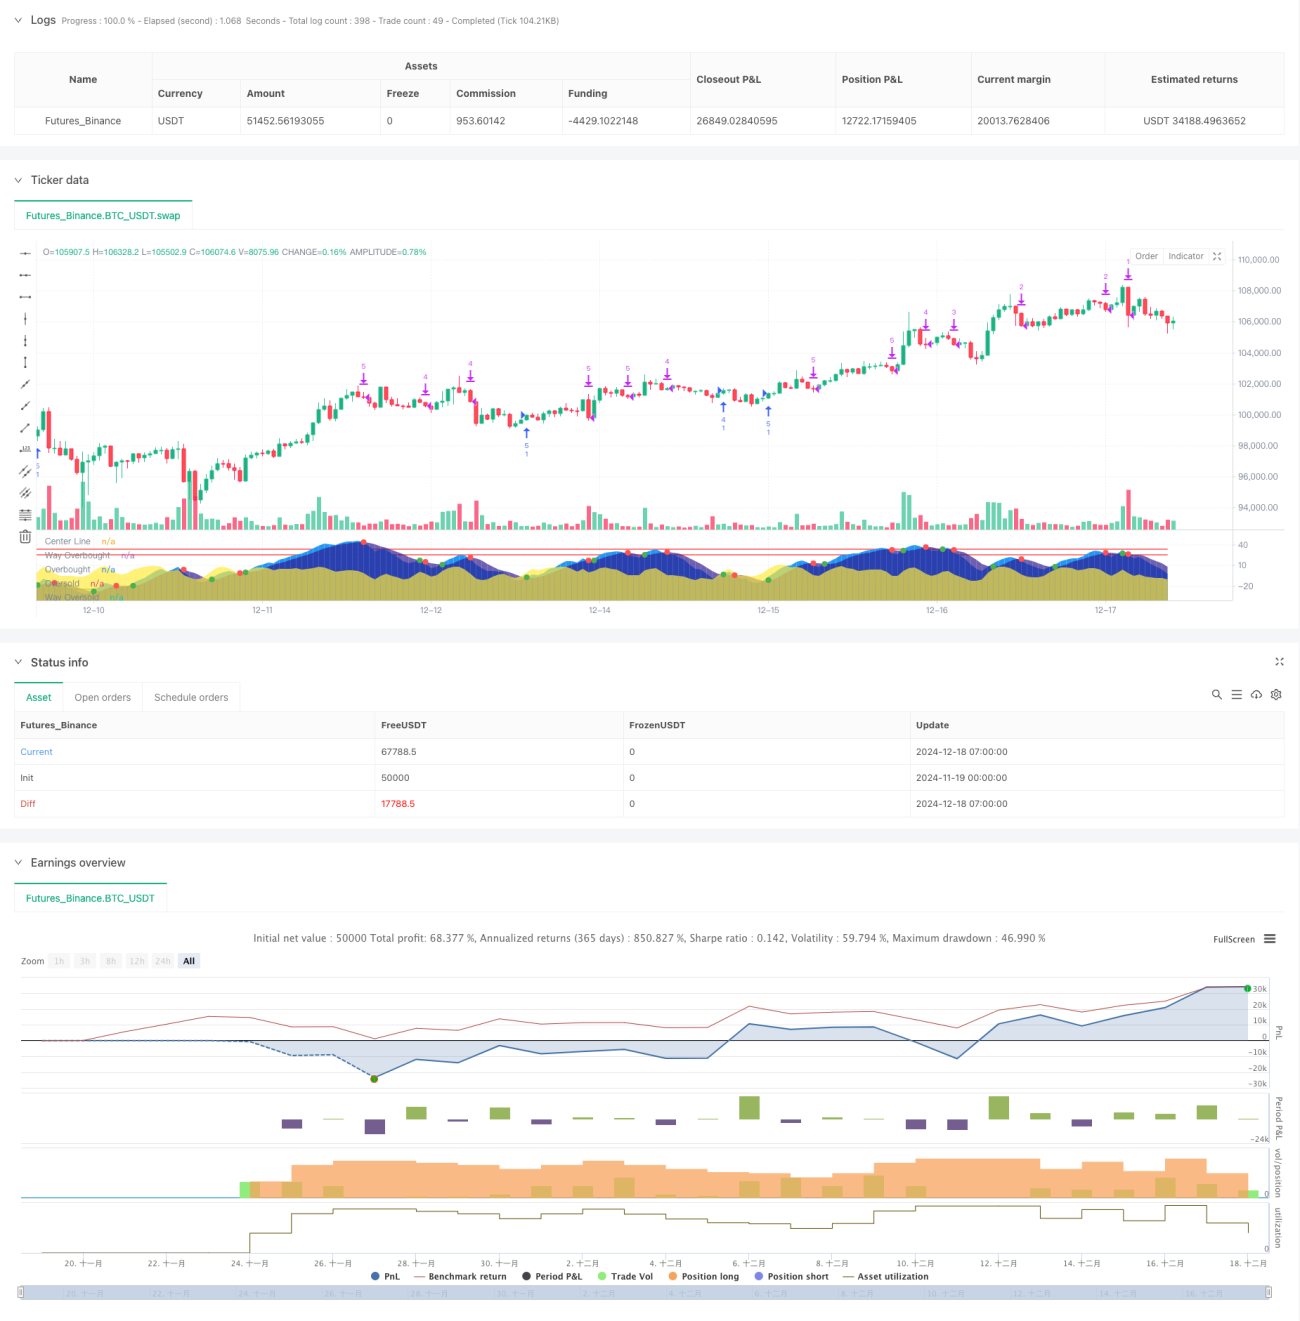
この戦略は,波動的トレンド指標 ((Wave Trend) と分散投資 ((Dollar Cost Averaging) の理念に基づいたスマート取引システムである. この戦略は,市場の変動傾向を分析し,市場が超売り区域にあるときに徐々にポジションを建設し,牛市が確認されたときに徐々に利益を得て結束する. この戦略は,技術分析とリスク管理の優位性を組み合わせて,市場サイクルで継続的にポジションを蓄積し,利益を得ることができる.

戦略原則

戦略の中核となるロジックには、次の重要な要素が含まれます。

  1. HLC3の価格平均値とインデックス移動平均 ((EMA) を用いて波動トレンド指標を計算し,市場の超買超売状態を識別する
  2. 驚異的な振動器 (Awesome Oscillator) によって大周期的なトレンドを判断し,牛熊市場の状態を決定する
  3. 熊市期には,価格が超売り領域にあるときに,積み重なった倉庫を建設し,倉庫建設の割合は,超売り程度に応じて動的に調整されます.
  4. 牛市が始まると,システムから”金を買いなさい”という信号が発せられ,その時点でポジションの建設が強化されます.
  5. 牛市の間,価格が超買区に入ると,超買の程度に応じて,システムは徐々に利潤を減額します.
  6. 熊市信号や市場のトップが表示されたとき,システムはすべてのポジションを空白し,利益をロックします.

戦略的優位性

  1. 倉庫建設コストを分散化して,追及リスクを回避する
  2. 複数のテクニカル指標を相互検証して取引シグナルの信頼性を向上させる
  3. ポジション管理は柔軟で,市場の動向に応じて取引量を調整する
  4. 強い防御性があり,熊市シグナルが発生した時にすぐに止まる
  5. 戦略の論理が明確で,パラメータが調整可能で,異なる市場環境に対応する

戦略リスク

  1. 取引コストを増加させるため,不安定な市場では取引が頻繁に発生する可能性があります.
  2. 分散型ストック戦略は,一方的な急上昇でベストバイポイントを逃す可能性があります.
  3. 技術指標の遅滞により,市場が急激に変動する際には反応が遅れる可能性があります.
  4. パラメータの設定が不適切であるため,倉庫の設立や撤収のタイミングが不正確になる可能性があります.

戦略最適化の方向性

  1. 波動率指標の導入,倉庫の増減量計算の最適化
  2. 市場情緒の指標を追加し,トレンド判断の正確さを向上させる
  3. 異なる市場周期の動態に応じてパラメータを調整する自適性パラメータシステムを開発
  4. 資金管理モジュールを追加し,より精密なポジション管理を実現

要約する

これは,技術分析とリスク管理を有機的に結合したスマート取引戦略である. 資金の安全性を保護しながら,波動的トレンド指標と分散投資方法によって,安定した収益成長を実現する. 戦略の核心的な優点は,異なる市場環境における適応性,明確な取引論理とリスク制御機構である.

ストラテジーソースコード
/*backtest
start: 2024-11-19 00:00:00
end: 2024-12-18 08:00:00
period: 1h
basePeriod: 1h
exchanges: [{"eid":"Futures_Binance","currency":"BTC_USDT"}]
*/

//@version=5

// Copyright (c) 2024 Seth Ethington.
// All rights reserved.
//
// If this script provides you Bread then share the Dough!
// BTC (God's Money) Address: bc1qrpxvea8ze4ayj2vtr0slp774rulm898gyhe3ss
//
// Redistribution and use in source and binary forms, 
// whether you tweak it or not, is totally fine, 
// but only if you swear on your life that BTC is God's Money! 
// 
// If you're redistributing the source code, 
// you must keep the above copyright notice and, 
// more importantly, the sacred BTC address!
//


strategy(title="Cipher DCA Strategy", shorttitle="Cipher DCA", overlay=false, initial_capital=100, pyramiding=30, currency=currency.USD,  slippage=1, commission_type=strategy.commission.percent, commission_value=0.1, default_qty_type=strategy.percent_of_equity, process_orders_on_close=true)

// Input parameters for the starting date
startDate = input(timestamp("2019-01-01 00:00:00"), title="Start Date (YYYY-MM-DD HH:MM:SS)")


// Input parameters for the indicator
fastLength = input.int(4, title="Fast Wave Length", group="Wave Calculator")  // Length for EMA smoothing of the price channel
slowLength = input.int(33, title="Slow Wave Length", group="Wave Calculator")  // Length for EMA smoothing of the trend channel
wayOverBoughtLevel = input.float(33, title="Way OverBought Level", group="Wave Calculator")
overBoughtLevel = input.float(25, title="Over Bought Level", group="Wave Calculator")
wayOverSoldLevel = input.float(-33, title="Way Over Sold Level", group="Wave Calculator")
overSoldLevel = input.float(-25, title="Over Sold Level", group="Wave Calculator")
accumulatingLevel = input.float(0, title="Accumulating Level", group="Wave Calculator")


// Calculate the average price (HLC3 = (High + Low + Close) / 3)
averagePrice = hlc3

// Compute the smoothed average price (ESA: Exponential Smoothing Average)
exponentialSmoothingAverage = ta.ema(averagePrice, fastLength)

// Compute the deviation (D) between the price and the smoothed average
priceDeviation = ta.ema(math.abs(averagePrice - exponentialSmoothingAverage), fastLength)

// Compute the commodity index (CI) which is normalized price movement
commodityIndex = (averagePrice - exponentialSmoothingAverage) / (0.015 * priceDeviation)

// Smooth the commodity index to create Wave Trend 1 (WT1)
fastWaveTrend = ta.ema(commodityIndex, slowLength)
// //log.info("fastWaveTrend= " + str.tostring(fastWaveTrend))

// Further smooth WT1 using a simple moving average to create Wave Trend 2 (WT2)
slowWaveTrend = ta.sma(fastWaveTrend, 5)
// //log.info("slowWaveTrend= " + str.tostring(slowWaveTrend))


// Plot the center line (0) for reference
plot(0, color=color.white, title="Center Line")

// Plot overbought and oversold levels
plot(wayOverBoughtLevel, color=color.red, title="Way Overbought")
plot(overBoughtLevel, color=color.red, title="Overbought")
plot(overSoldLevel, color=color.green, title="Oversold")
plot(wayOverSoldLevel, color=color.green, title="Way Oversold")

// Plot WT1 and WT2 as filled areas for better visibility
plot(fastWaveTrend, style=plot.style_area, color=color.new(color.blue, 0), title="Fast Wave")
plot(slowWaveTrend, style=plot.style_area, color=color.new(color.navy, 30), title="Slow Wave")

// Highlight the difference between fastWave vs slowWave
waveTrendDifference = fastWaveTrend - slowWaveTrend

// //log.info("waveTrendDifference=" + str.tostring(waveTrendDifference))
plot(waveTrendDifference, color=color.new(color.yellow, 30),style=plot.style_area, title="WT1 - WT2 Difference") //No transparency

// Plot buy and sell signals at crossovers
isCrossover = ta.cross(fastWaveTrend, slowWaveTrend)
// //log.info("isCrossover=" + str.tostring(isCrossover))
plot(isCrossover ? slowWaveTrend : na, color=(slowWaveTrend - fastWaveTrend > 0 ? color.red : color.green), style=plot.style_circles, linewidth=4, title="Crossover Signals")

float waveTrend = na
if (slowWaveTrend > 0 and fastWaveTrend > 0) 
    waveTrend := math.max(slowWaveTrend, fastWaveTrend)
    // //log.info("Both trends are positive. waveTrend set to max value: " + str.tostring(waveTrend))
else if (slowWaveTrend < 0 and fastWaveTrend < 0)
    waveTrend := math.min(slowWaveTrend, fastWaveTrend)
    // //log.info("Both trends are negative. waveTrend set to min value: " + str.tostring(waveTrend))
else 
    waveTrend := 0
    // //log.info("Trends are mixed. waveTrend set to 0.")

// Time to Sell
isCrossingDown = waveTrendDifference < 0

// Time to Buy
isCrossingUp = waveTrendDifference > 0


//-----------------------------------------------------------


// Detect Bull Market and Bear Market using the Awesome Oscillator
// User input for AO thresholds
ao_threshold = input.float(-10, "AO Bull Market Threshold", minval=-50, maxval=50, step=1, group = "Bear and Bull Thresholds")
ao_cycletop_threshold = input.float(5, "AO Bear Market Threshold", minval=0, maxval=200, step=1, group = "Bear and Bull Thresholds")

// Define the Awesome Oscillator
ao = ta.sma(hl2, fastLength) - ta.sma(hl2, slowLength)

// Convert current bar time to the first day of the month for monthly calculations
currentMonthStart = timestamp(year, month, 1, 0, 0)
prevMonthStart = time - (time - currentMonthStart)

// Calculate AO for the start of the month and previous month
aoCurrentMonth = request.security(syminfo.tickerid, 'M', ao[0])
aoPrevMonth1    = request.security(syminfo.tickerid, 'M', ao[1])
aoPrevMonth2    = request.security(syminfo.tickerid, 'M', ao[2])

// Detect bull market based on monthly AO
isBullMarket = aoCurrentMonth > aoPrevMonth1 and aoPrevMonth1 > aoPrevMonth2 and aoCurrentMonth > ao_threshold

// Detect cycle top based on monthly AO
isBearMarket = aoCurrentMonth > ao_cycletop_threshold and aoPrevMonth1 > aoCurrentMonth

// Detect when a bull market is starting
var bool isBullMarketStarting = na
if (not isBullMarket[1] and isBullMarket)
    isBullMarketStarting := true
else
    isBullMarketStarting := false

// Logging
//log.info("isBullMarket is " + str.tostring(isBullMarket))
//log.info("isCycleTop is " + str.tostring(isBearMarket))

// Plot transparent overlays for Bull Market and Cycle Top
overlayColor = isBullMarket ? color.new(color.green, 80) : isBearMarket ? color.new(color.red, 60) : na
bgcolor(overlayColor, title="Market Condition Overlay")


//----------------------------------------------------------


// Calculate Potential Liquidations and Golden Buy Zones
volLength = input.int(20, "Volume Length", minval=1, group="Golden Buy Indicator")
volStdDevThreshold = input.float(2.0, "Volume Standard Diviation Threshold", step=0.1, group="Golden Buy Indicator")
aoWeeklyThreshold = input.int(0, "Awesome Oscillator Oversold Threshold", step=1, group="Golden Buy Indicator")


// Start Accumulating when the price is oversold or price action is flat
isStartAccumulating = waveTrend <= accumulatingLevel and not isBearMarket

// Start Selling when we are now in a Bull Market
isStartSelling = waveTrend > accumulatingLevel

// Calculate Overbought and Oversold Levels
isOverSold = waveTrend < overSoldLevel
isWayOverSold = waveTrend < wayOverSoldLevel
isOverBought = waveTrend > overBoughtLevel
isWayOverBought = waveTrend > wayOverBoughtLevel
//log.info("isOverSold= " + str.tostring(isOverSold) + " isWayOverSold= " + str.tostring(isWayOverSold) + " isOverBought= " + str.tostring(isOverBought) + " isWayOverBought= " + str.tostring(isWayOverBought))

//Weekly Awesome Oscillator to detect oversold levels
aoWeekly = request.security(syminfo.tickerid, "W", ao)

// Get standard deviation of volume over last 20 bars
volumeStDev = ta.stdev(volume, volLength)

// Detect volume spikes
volumeSpike = volume > (ta.sma(volume, volLength) + volStdDevThreshold * volumeStDev)

isGoldenBuyZone = volumeSpike and aoWeekly < aoWeeklyThreshold and not isBearMarket
plotshape(series=isGoldenBuyZone ? -60 : na, style=shape.triangleup, location=location.absolute, color=color.yellow, size=size.tiny, offset=0, title="Golden Buy Zone")

isMarketTop = volumeSpike and aoWeekly > -aoWeeklyThreshold and isBullMarket
plotshape(series=isMarketTop ? 60 : na, style=shape.triangledown, location=location.absolute, color=color.purple, size=size.tiny, offset=0, title="Market Top")


//---------------------------------------------------------

// Buying and Selling Input parameters for the indicator
isBullMarketStartingPercent = input.float(1.0, title="Starting a Bull Market Percent", step=0.01, group="Buy and Sell")
goldenBuyPercent = input.float(0.00006, title="Golden Buy Percent", step=0.01, group="Buy and Sell")
wayOverSoldPercent = input.float(0.00004, title="Way Over Sold Percent", step=0.01, group="Buy and Sell") 
overSoldPercent = input.float(0.00002, title="Over Sold Percent", step=0.01, group="Buy and Sell")
crossOverPercent = input.float(0.00002, title="Cross Over Percent", step=0.01, group="Buy and Sell")
overBoughtPercent = input.float(0.00005, title="Over Bought Percent", step=0.01, group="Buy and Sell")
wayOverBoughtPercent = input.float(0.00006, title="Way Over Bought Percent", step=0.01, group="Buy and Sell")

//Execute Buy and Sell Strategy
// Execute only if the bar's time is after the start date
if (true)
    if ((isCrossover and isCrossingUp and isStartAccumulating) or isGoldenBuyZone or isBullMarketStarting)
        if (isGoldenBuyZone) 
            strategy.entry("Golden Buy", strategy.long, qty = goldenBuyPercent * strategy.initial_capital)
            //log.info("Golden Buy " + str.tostring(goldenBuyPercent))
        else if (isBullMarketStarting)
            strategy.entry("Bull Buy", strategy.long, qty = isBullMarketStartingPercent * strategy.initial_capital)
            //log.info("Way Over Sold Buy " + str.tostring(wayOverSoldPercent))    
        else if (isWayOverSold) 
            strategy.entry(str.tostring(strategy.opentrades), strategy.long, qty = wayOverSoldPercent * strategy.initial_capital)
            //log.info("Way Over Sold Buy " + str.tostring(wayOverSoldPercent))
        else if (isOverSold)  
            strategy.entry(str.tostring(strategy.opentrades), strategy.long, qty = overSoldPercent * strategy.initial_capital)
            //log.info("Over Sold Buy " + str.tostring(overSoldPercent))
        else if (isCrossover)  
            strategy.entry(str.tostring(strategy.opentrades), strategy.long, qty = crossOverPercent * strategy.initial_capital)
            //log.info("Crossover Buy " + str.tostring(crossOverPercent))
    else if (isCrossover and isCrossingDown and isStartSelling) or isBearMarket or isMarketTop
        if (isBearMarket)
            strategy.close_all("Close all")
            //log.info("Closing All Open Positions")
        else if (isWayOverBought or isMarketTop) 
            int openTrades = strategy.opentrades  // Get the number of open trades
            int tradesToClose = math.floor(openTrades * wayOverBoughtPercent)
            //log.info("# of tradesToClose= " + str.tostring(tradesToClose))
    
            // Loop through and close 100% of the open trades determined
            for i = 0 to tradesToClose
                // Close the trade by referencing the correct index
                strategy.close(str.tostring(openTrades - 1 - i), qty_percent = 100)
                //log.info("Sell 100%: Closed trade # " + str.tostring(openTrades - 1 - i))
        else if (isOverBought) 
            int openTrades = strategy.opentrades  // Get the number of open trades
            int tradesToClose = math.floor(openTrades * overBoughtPercent) 
            //log.info("# of tradesToClose= " + str.tostring(tradesToClose))
    
            // Loop through and close 100% of the open trades determined
            for i = 0 to tradesToClose
                // Close the trade by referencing the correct index
                strategy.close(str.tostring(openTrades - 1 - i), qty_percent = 100)
                //log.info("Sell 100%: Closed trade # " + str.tostring(openTrades - 1 - i))
        else if (isStartSelling)
            strategy.close(str.tostring(strategy.opentrades - 1), qty_percent =50)
            //log.info("Sell 100% of Last Trade: Closed trade # " + str.tostring(strategy.opentrades - 1))