EMAクロスオーバーとキャンドル浸透をダイナミックな購入戦略と組み合わせる
EMA
作成日:
2024-12-20 16:50:41
最終変更日:
2024-12-20 16:50:41
コピー:
0
クリック数:
562
1
フォロー
1750
フォロワー
概要
この戦略は,14周期指数移動平均 ((EMA) をベースに,グラフ技術分析と組み合わせた買取戦略である.この戦略は,価格とEMAの交差関係を観察し,体の形状特性を組み合わせて,市場の買取タイミングを決定する.この方法は,トレンド要因を考慮するだけでなく,価格構造分析に組み込まれ,より包括的な取引システムを形成する.
戦略原則
戦略の核心的な論理は,以下のいくつかの重要な条件の組み合わせに基づいています.
- 14サイクルEMAを主要トレンド基準線として使用
- EMAを突破し,上昇交差点を形成する
- 現在のK線が陽線であることを確認する (閉盘価格が開盘価格より高い)
- 体の少なくとも50%がEMA上にあることを要求する
- 上下引線の総長さは,全体の長さの40%を超えない これらの条件が同時に満たされると,戦略は買い信号を発する.この複数のフィルタリング機構は,偽信号を効果的に減らすことができる.
戦略的優位性
- 信号確認機構の改善:EMAクロスと体形状分析を組み合わせて,信号の信頼性が大幅に向上
- リスク管理の合理化:引線長さの比率を制限することで,過度の波動的な市場環境を回避
- パラメータ設定の柔軟性: 14サイクルEMAと50%体浸透率は,異なる市場特性に合わせて調整できます
- 実行基準は明確である:戦略の各条件は,具体的数学的に定義され,量的に実現する
- 明確な視覚フィードバック: グラフマーク機能により,トレーダーは直感的に購入シグナルを見ることができます.
戦略リスク
- トレンド継続リスク: EMAの交差信号がトレンドの末端に現れ,偽ブレイクを引き起こす可能性がある
- 市場の波動リスク: 波動が強い市場では,すべての条件を満たした信号が失効する可能性があります.
- 参数感受性リスク: EMA サイクルと体条件の設定が戦略のパフォーマンスに大きな影響を与える
- 遅滞の危険性:EMAは遅滞の危険性があり,入場の最適なタイミングを逃す可能性があります.
- 市場環境依存:戦略は市場環境によって大きく異なる
戦略最適化の方向性
- 交差量指標の導入:交差量確認により信号の信頼性向上
- トレンド強度フィルターを追加する:他のトレンド指標であるADXと組み合わせて,より強いトレンド環境をフィルターする
- オプティマイズされた止損設定:ATRまたは重要支柱位置の設定に基づく動的止損
- エグジットメカニズムを完善する: 入場ロジックに対応したエグジット条件を設計する
- 市場周期分析:異なる市場周期に応じて戦略パラメータを調整する
要約する
これは,技術分析の複数の次元を融合した買い戦略であり,EMAのトレンド追跡と図形状分析を組み合わせることで,比較的完ぺきな取引システムを構築している.この戦略の主な優点は,その信号確認機構の信頼性とリスク管理の合理性にある.いくつかの固有のリスクがあるものの,提案された最適化方向によって,戦略の安定性と信頼性がさらに向上する見込みがある.
ストラテジーソースコード
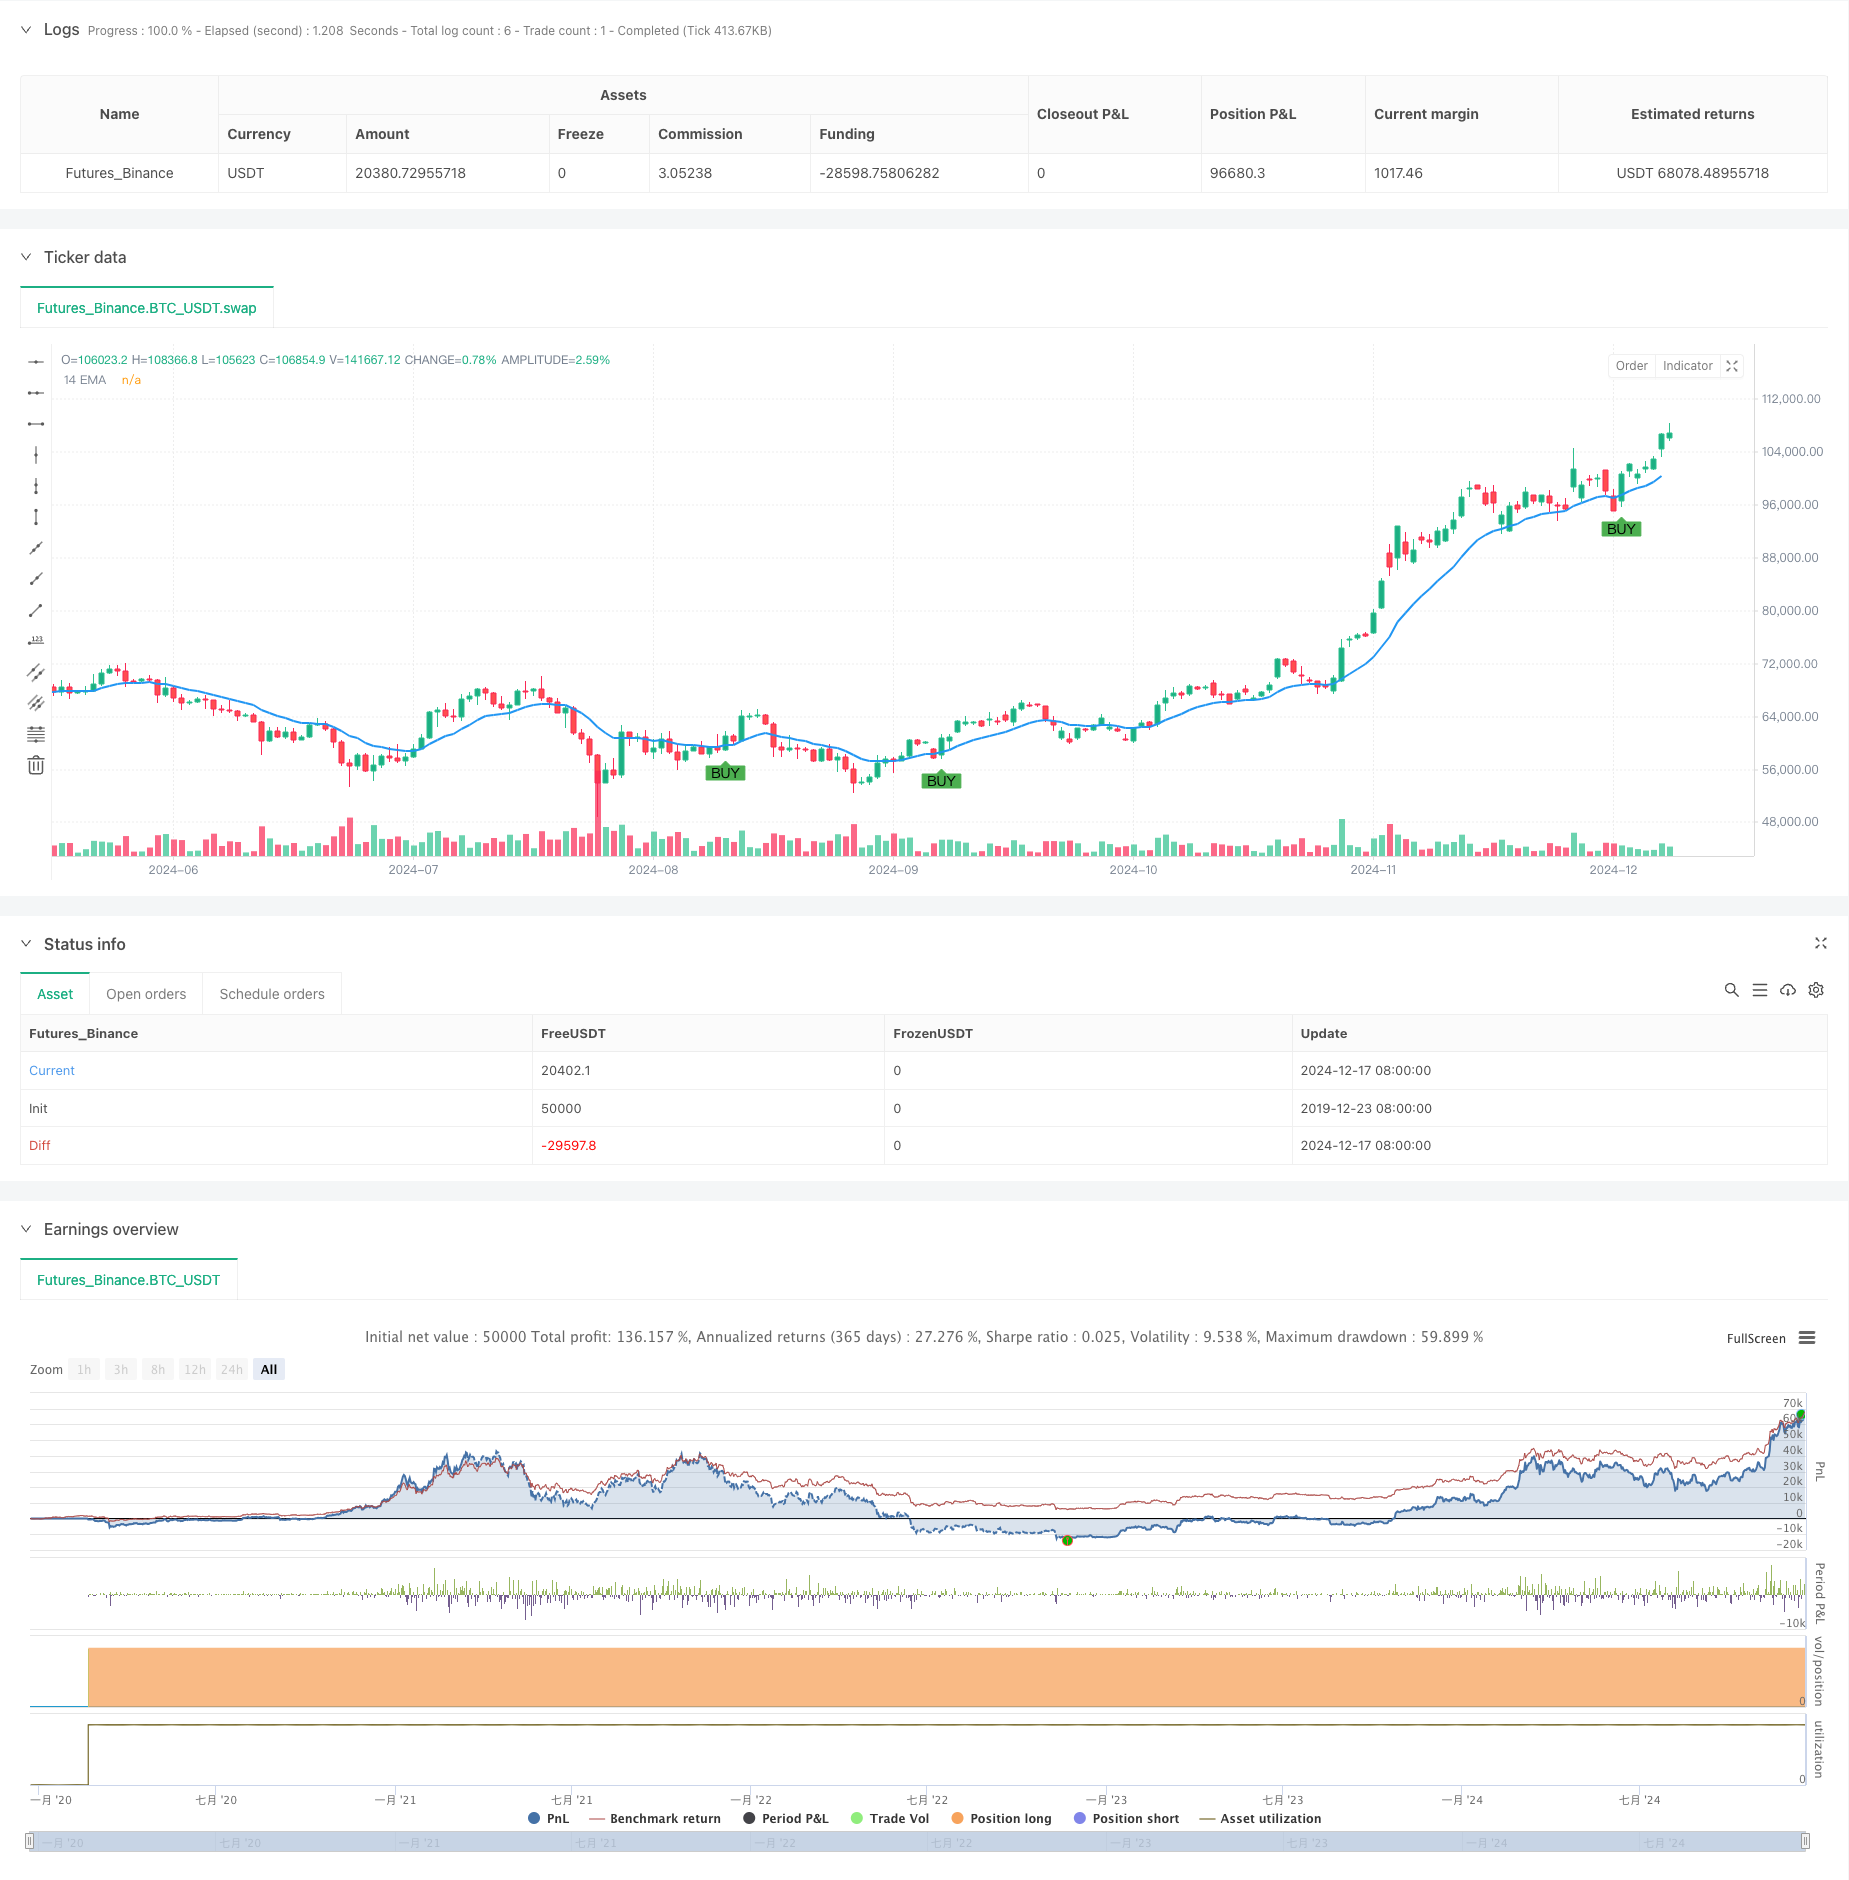
/*backtest
start: 2019-12-23 08:00:00
end: 2024-12-18 08:00:00
period: 1d
basePeriod: 1d
exchanges: [{"eid":"Futures_Binance","currency":"BTC_USDT"}]
*/

//@version=5
strategy("Buy Entry with EMA Crossing and Wick Conditions", overlay=true)

// Define the EMA length
ema_length = input.int(14, title="EMA Length")

// Calculate the 14 EMA
ema_14 = ta.ema(close, ema_length)

// Calculate the candle body and wicks
body = close - open
upper_wick = high - close
lower_wick = open - low
total_candle_length = high - low

// Define the condition for the candle to be green (bullish)
is_green_candle = close > open

// Condition for crossing the 14 EMA (previous close was below, current close is above)
crossing_ema = ta.crossover(close, ema_14)

// Condition for at least 50% of the candle's body crossing the 14 EMA
body_crossed_ema = (close - open) * 0.5 <= (close - ema_14) and close > ema_14

// Condition for wick percent being less than or equal to 40% of the total candle length
wick_percent = (upper_wick + lower_wick) / total_candle_length
valid_wick_condition = wick_percent <= 0.4

// Define the buy condition
buy_condition = is_green_candle and crossing_ema and body_crossed_ema and valid_wick_condition

// Plot the 14 EMA on the chart
plot(ema_14, color=color.blue, linewidth=2, title="14 EMA")

// Plot the buy signal as an arrow on the chart
plotshape(buy_condition, color=color.green, style=shape.labelup, location=location.belowbar, text="BUY")

// Optional: Add a strategy for backtesting
if (buy_condition)
    strategy.entry("Buy", strategy.long)