ATR動的リスク制御に基づく複数の移動平均協調トレンド変動取引戦略

1
Follow
1785
Followers
概要
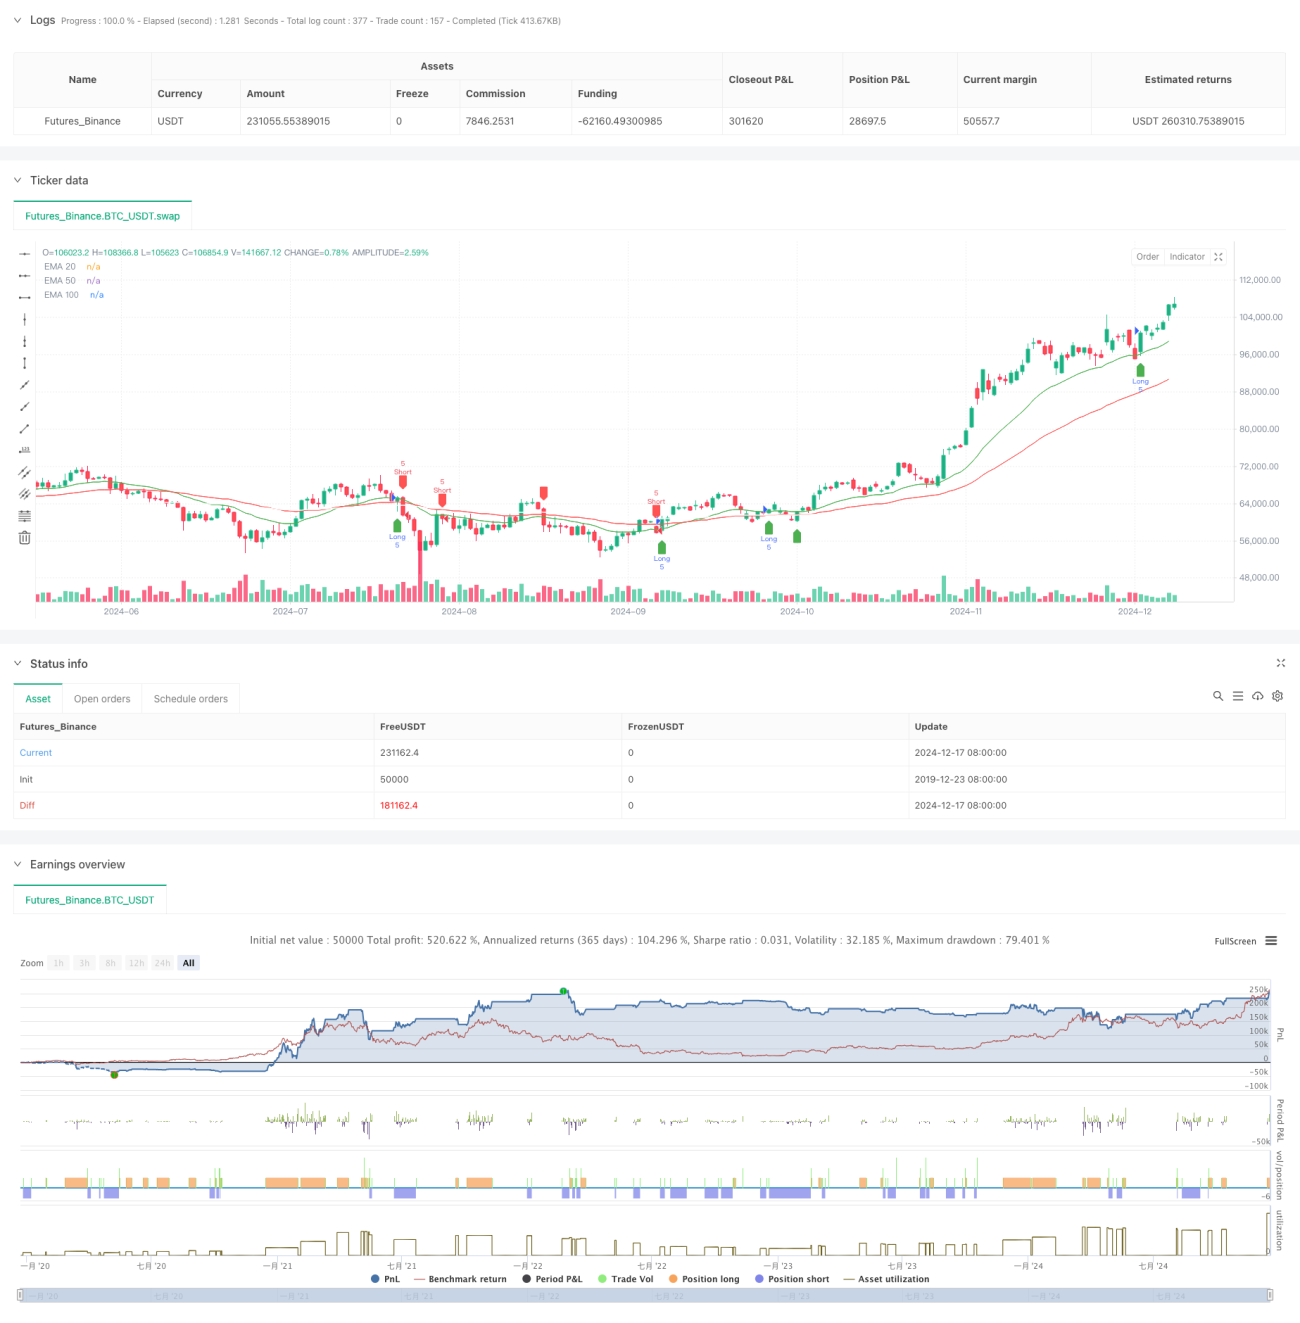
この戦略は,複数の指数移動平均 ((EMA) と実際の波動幅 ((ATR) に基づくトレンド追跡取引システムである.この戦略は,20周期,50周期,および100周期の3つのEMAの協調的な配合によって市場トレンドを捉え,ATRを利用して,ダイナミックなリスク管理と利益目標を設定する.この方法は,取引の体系性を保証するとともに,リスクのダイナミックな制御を実現する.
戦略原則
戦略の核心的な論理は,価格と複数のEMAの間の相互作用に基づいています.具体的には:
- 入場シグナルは,価格と20周期EMAの交差に基づいており,50周期EMAをトレンドフィルターとして使用します.
- 多頭入場条件:価格が20サイクルEMAを穿い,50サイクルEMA上にある
- 空頭入場条件:価格が20サイクルEMAを超え,50サイクルEMA以下である
- ストップ・ロズ設定:14サイクルATRの動的計算に基づいて,ストップ・ロズポイントが市場の変動に適応することを保証する
- 利益目標:リスクの1.5倍の利益率,つまり利益目標の1.5倍の止損距離
戦略的優位性
- 複数のタイムサイクル検証: 20/50/100のトリプルEMAの配合により,偽信号を効果的に減少させる
- ダイナミックなリスク管理:ATRベースの止損設定により,リスク管理が市場に対応できるようになります.
- 明確なリスク/利益率:長期にわたって安定した利益を得るために,固定1.5倍のリスク/利益率を設定
- トレンド追跡と振動把握の組み合わせ:大トレンドを把握し,短期波段のチャンスを逃さない
- ビジュアル取引シグナル: 戦略は,トレーダーが理解し,実行するための明確なグラフィックインタフェースを提供します.
戦略リスク
- 横盤整理の段階で頻繁に偽のブレイクシグナルが生じる可能性
- スライドポイントリスク:市場の急速な波動で,実際の取引価格とシグナル価格の偏差がある可能性がある
- トレンドの逆転リスク: 強いトレンドが突然逆転すると,大きな損失を招く可能性があります.
- パラメータ最適化リスク: 過度に最適化すると、実際の取引で戦略のパフォーマンスが低下する可能性があります。
戦略最適化の方向性
- 取引量指標の導入:取引量によって価格突破の有効性を確認できる
- トレンド強度フィルターを追加:入場品質を向上させるため,ADXなどのトレンド強度指標の導入を検討
- ストップを最適化する方法: トラッキングストップを導入し,利益をよりよくロックすることを検討する
- 市場環境の分類:異なる市場環境に応じて戦略パラメータの調整
- 波動性フィルターの導入:過度に波動的な市場環境で取引を一時停止する
要約する
この戦略は,多重均線システムとATRダイナミック・ウィンドコントロールの組み合わせにより,トレンド追跡と波段操作の特徴を兼ね備えた取引システムを構築している.戦略の優点は,システム的に強みがあり,リスクが制御可能であることである.しかし,実際のアプリケーションでは,市場環境の適応性に注意を払い,実際の状況に応じてターゲティング・最適化を行う必要がある.合理的なパラメータ設定と厳格なリスク管理により,この戦略は,ほとんどの市場環境で安定した取引効果を期待されている.
Source
Pine
Strategy parameters
Related strategies
Comment
All comments (0)
No data
- 1