EMAとSMAに基づくマルチインジケーターダイナミックトレンド追跡戦略

EMA SMA ATR PP supertrend
作成日: 2024-12-27 14:12:50 最終変更日: 2024-12-27 14:12:50
コピー: 0 クリック数: 426
1
フォロー
1617
フォロワー

EMAとSMAに基づくマルチインジケーターダイナミックトレンド追跡戦略

戦略概要

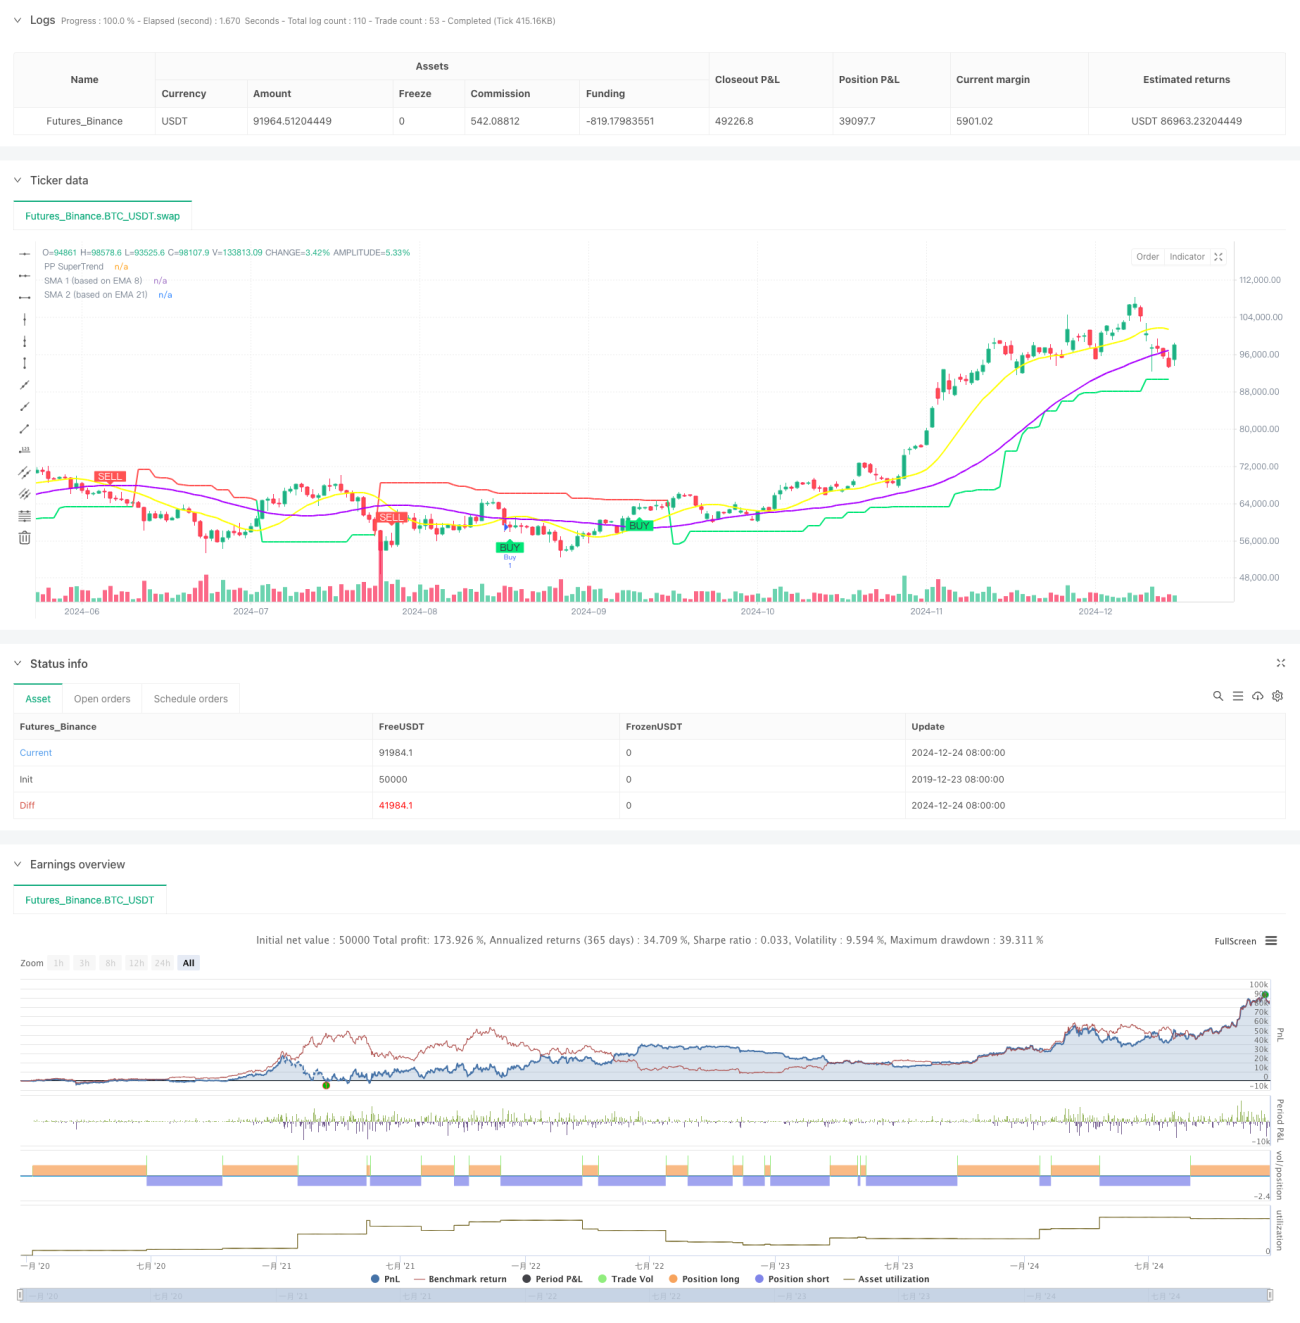
この戦略は,複数の技術指標を組み合わせたダイナミックなトレンド追跡システムである.これは,ピボットポイント,スーパートレンド指標,および移動平均の交差シグナルを統合することによって,市場動向と取引機会を識別する.戦略の核心的な特徴は,固定時間周期の分析方法を採用し,信号の一致性を確保し,同時に,ピボットポイントの検証によって取引信号の信頼性を向上させるものである.

戦略原則

この戦略は、次のコアメカニズムに基づいて機能します。

  1. 固定時間周期の価格データを用いて分析し,異なる時間周期による干渉を避ける
  2. 8サイクルと21サイクルEMAのSMA計算により,トレンド追跡の基礎を形成
  3. ATRと支点の組み合わせで計算されるスーパートレンド指標は,トレンドの方向を確認するために使用される
  4. 支点位3周期間のSMA交差信号が有効信号とみなされる
  5. 動的計算とサポート/レジスタンス値を追跡し,取引決定に参考になります.

戦略的優位性

  1. 複数の指標のクロス検証により,信号の信頼性が向上する
  2. 固定時間周期分析,偽信号干渉を減らす
  3. 取引が重要な価格レベルで行われていることを保証する点位検証メカニズム
  4. ダイナミック・トラッキング・サポート・レジスタンス・ビート,ストップ・ダメージ・ストップの位置を特定する
  5. SuperTrendの指標の使用は,トレンドの方向性を追加的に確認します.
  6. 柔軟なパラメータ設定,異なる市場状況に応じて調整できます

戦略リスク

  1. 複数のインジケーターにより信号遅延が発生する場合があります
  2. 横盤市場では偽信号が多く発生する可能性がある.
  3. 固定時間周期分析は,他の周期の重要な信号を逃している可能性があります.
  4. ポイント・バイト・検証は,重要な取引機会を逃す可能性があります.
  5. パラメータを過度に最適化すると,過度にフィットする可能性があります.

戦略最適化の方向性

  1. 低波動期間の取引頻度を減らすため,波動性フィルタリングの導入
  2. ADXやMACDのようなトレンド強さの確認指標を増加させる
  3. 市場状況に応じてパラメータを動的に調整する自己適応パラメータシステムを開発
  4. 取引量分析を追加してシグナルの信頼性を向上させる
  5. 市場変動に応じてストップポジションを調整するダイナミックストップメカニズムを導入する

要約する

この戦略は,複数の技術指標を組み合わせて,比較的完全なトレンド追跡取引システムを構築している.その核心的な優位性は,固定時間周期分析と支点位検証によって信号信頼性を向上させることにある.ある程度の遅れのリスクは存在するが,パラメータの最適化とリスク管理措置によって効果的に制御することができる.トレーダーは,実用化する前に十分な反測を行い,特定の市場の特徴に応じてパラメータを調整することを推奨している.

ストラテジーソースコード
/*backtest
start: 2019-12-23 08:00:00
end: 2024-12-25 08:00:00
period: 1d
basePeriod: 1d
exchanges: [{"eid":"Futures_Binance","currency":"BTC_USDT"}]
*/

//@version=6
strategy("Buy Sell Pivot Point", overlay=true)

// Input Parameters
prd = input.int(defval=2, title="Periodo Pivot Point", minval=1, maxval=50)
Factor = input.float(defval=3, title="Fator ATR", minval=1, step=0.1)
Pd = input.int(defval=10, title="Periodo ATR", minval=1)
showpivot = input.bool(defval=false, title="Mostrar Pivot Points")
showlabel = input.bool(defval=true, title="Mostrar Buy/Sell Labels")
showcl = input.bool(defval=false, title="Mostrar PP Center Line")
showsr = input.bool(defval=false, title="Mostrar Support/Resistance")
sma1_length = input.int(defval=8, title="SMA 1")
sma2_length = input.int(defval=21, title="SMA 2")
timeframe_fix = input.timeframe("D", title="Timeframe Fixo")

// Request data from the fixed timeframe
fix_close = request.security(syminfo.tickerid, timeframe_fix, close)
fix_high = request.security(syminfo.tickerid, timeframe_fix, high)
fix_low = request.security(syminfo.tickerid, timeframe_fix, low)
fix_ph = request.security(syminfo.tickerid, timeframe_fix, ta.pivothigh(prd, prd))
fix_pl = request.security(syminfo.tickerid, timeframe_fix, ta.pivotlow(prd, prd))
fix_atr = request.security(syminfo.tickerid, timeframe_fix, ta.atr(Pd))

// Convert Pivot High/Low to valid boolean for conditions
ph_cond = not na(fix_ph)
pl_cond = not na(fix_pl)

// Draw Pivot Points
plotshape(ph_cond and showpivot, title="Pivot High", text="H", style=shape.labeldown, color=color.red, textcolor=color.red, location=location.abovebar, offset=-prd)
plotshape(pl_cond and showpivot, title="Pivot Low", text="L", style=shape.labelup, color=color.lime, textcolor=color.lime, location=location.belowbar, offset=-prd)

// Calculate the Center line using pivot points
var float center = na
lastpp = ph_cond ? fix_ph : pl_cond ? fix_pl : na
if not na(lastpp)
    center := na(center) ? lastpp : (center * 2 + lastpp) / 3

// Upper/Lower bands calculation
Up = center - (Factor * fix_atr)
Dn = center + (Factor * fix_atr)

// Get the trend
var float TUp = na
var float TDown = na
var int Trend = 0
TUp := na(TUp[1]) ? Up : fix_close[1] > TUp[1] ? math.max(Up, TUp[1]) : Up
TDown := na(TDown[1]) ? Dn : fix_close[1] < TDown[1] ? math.min(Dn, TDown[1]) : Dn
Trend := fix_close > TDown[1] ? 1 : fix_close < TUp[1] ? -1 : nz(Trend[1], 1)
Trailingsl = Trend == 1 ? TUp : TDown

// Plot the trend
linecolor = Trend == 1 ? color.lime : Trend == -1 ? color.red : na
plot(Trailingsl, color=linecolor, linewidth=2, title="PP SuperTrend")

// Plot Center Line
plot(showcl ? center : na, color=showcl ? (center < fix_close ? color.blue : color.red) : na, title="Center Line")

// Calculate Base EMAs
ema_8 = ta.ema(fix_close, 8)
ema_21 = ta.ema(fix_close, 21)

// Calculate SMAs based on EMAs
sma1 = ta.sma(ema_8, sma1_length)
sma2 = ta.sma(ema_21, sma2_length)

// Plot SMAs
plot(sma1, color=#ffff00, linewidth=2, title="SMA 1 (based on EMA 8)")
plot(sma2, color=#aa00ff, linewidth=2, title="SMA 2 (based on EMA 21)")

// Initialize variables to track pivot points
var float last_pivot_time = na

// Update the pivot time when a new pivot is detected
if (ph_cond)
    last_pivot_time := bar_index
if (pl_cond)
    last_pivot_time := bar_index

// Calculate the crossover/crossunder signals
buy_signal = ta.crossover(sma1, sma2)  // SMA 8 crossing SMA 21 upwards
sell_signal = ta.crossunder(sma1, sma2)  // SMA 8 crossing SMA 21 downwards

// Ensure signal is only valid if it happens within 3 candles of a pivot point
valid_buy_signal = buy_signal and (bar_index - last_pivot_time <= 3)
valid_sell_signal = sell_signal and (bar_index - last_pivot_time <= 3)

// Plot Buy/Sell Signals
plotshape(valid_buy_signal and showlabel, title="Buy Signal", text="BUY", style=shape.labelup, color=color.lime, textcolor=color.black, location=location.belowbar)
plotshape(valid_sell_signal and showlabel, title="Sell Signal", text="SELL", style=shape.labeldown, color=color.red, textcolor=color.white, location=location.abovebar)

// Get S/R levels using Pivot Points
var float resistance = na
var float support = na
support := pl_cond ? fix_pl : support[1]
resistance := ph_cond ? fix_ph : resistance[1]

// Plot S/R levels
plot(showsr and not na(support) ? support : na, color=showsr ? color.lime : na, style=plot.style_circles, offset=-prd)
plot(showsr and not na(resistance) ? resistance : na, color=showsr ? color.red : na, style=plot.style_circles, offset=-prd)

// Execute trades based on valid signals
if valid_buy_signal
    strategy.entry("Buy", strategy.long)
if valid_sell_signal
    strategy.entry("Sell", strategy.short)

// Alerts
alertcondition(valid_buy_signal, title="Buy Signal", message="Buy Signal Detected")
alertcondition(valid_sell_signal, title="Sell Signal", message="Sell Signal Detected")
alertcondition(Trend != Trend[1], title="Trend Changed", message="Trend Changed")