
1
Follow
1781
Followers
概要
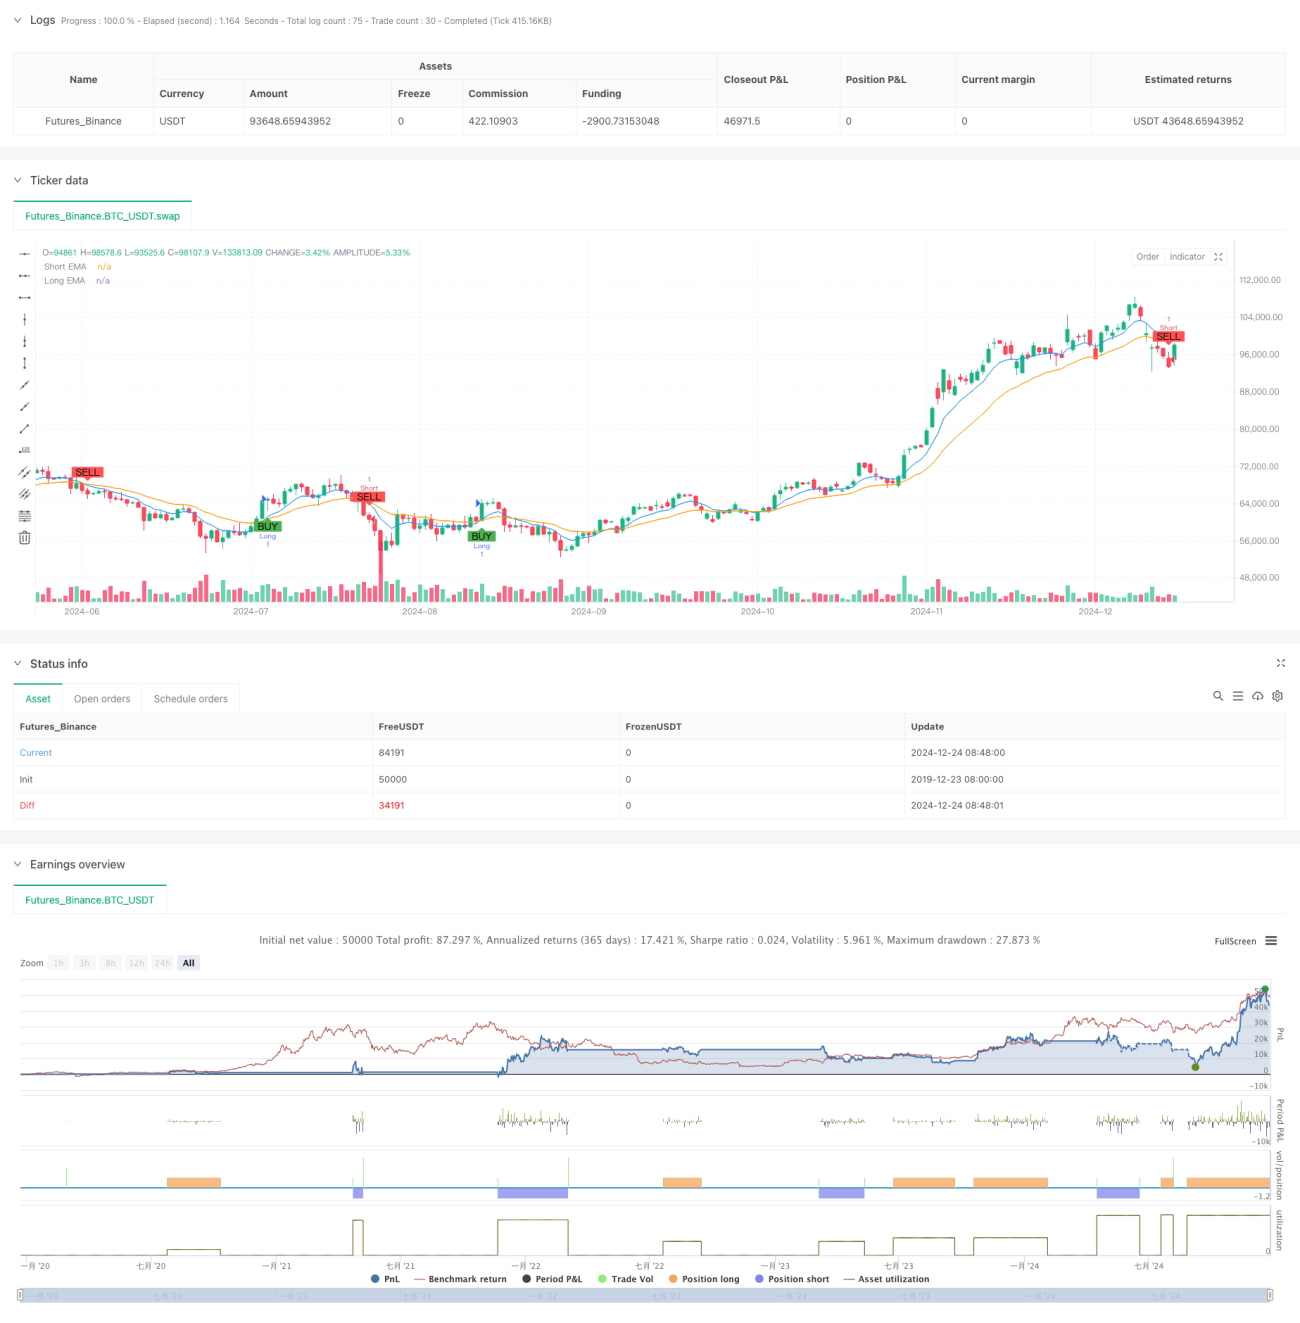
これは,複数の技術指標の組み合わせに基づいた高周波波段の取引戦略である.この戦略は,指数移動平均 ((EMA),相対的に強い指数 ((RSI),取引量分析およびNサイクル価格パターンの認識などの複数の次元の市場信号を組み合わせて,ショートラインの取引で最適なエントリータイミングを探します.この戦略は,ストップ・ロストを設定することによって,厳格なリスク管理機構を採用し,資金の安全性を保護します.
戦略原則
戦略の核心的な論理は,多次元信号の協調的な配合によって取引方向を確認することである.
- 短期トレンドの方向を判断するために,8周期と21周期のEMAの交叉を使用
- 14サイクルRSIで市場動力を検証し,RSI>50で多頭動力を確認し,RSI<50で空頭動力を確認する
- 現在の取引量と20サイクル平均取引量を比較して,市場の活性を確保する
- 最新の5つのK線と前10のK線の最高最低点を比較して潜在的逆転形状を識別する
上記のシグナルが同時に満たされた場合にのみ,戦略は取引シグナルを発信する.複数頭シグナルが現れた場合,市価格で多開き,空頭シグナルが現れた場合,市価格で空開きを行う.同時に1.5%のストップ・ストップと0.7%のストップ・ストップを設定してリスクを制御する.
戦略的優位性
- マルチ次元信号のクロス検証により,偽信号の影響を大幅に軽減
- トレンドトラッキングとモチベーション取引の利点と組み合わせることで,戦略の適応性が向上する
- 取引量確認により,市場が穏やかな時期に取引を避ける
- Nサイクル形状認識により,市場逆転の信号を早期に検出
- 合理的なストップ・ストラスト比率を設定し,リスクを効果的に管理する
- 戦略の論理が明確で,パラメータの継続的な最適化と調整が可能です.
戦略リスク
- 高波動の市場では,しばしばストップをトリガーすることがあります.
- 販売業者の出荷の遅延に敏感である
- 複数の指標を同時に満たす機会は比較的少ない
- 変動する市場では連続したストップが起こりうる
対策:
- ストップ・ストラスト比率は市場の変動に合わせて調整できます.
- 流動性の高い時期に取引することをお勧めします
- パラメータの最適化により信号の量と質をバランスさせることができる
- トレーリングストップのダイナミックストップは,収益性を高めるために使用することが推奨されています.
戦略最適化の方向性
- 適応パラメータ調整メカニズムを導入し,市場状況に応じてパラメータを自動的に最適化できるようにします.
- 市場波動率のフィルターを追加し,過度に波動的な市場環境で取引を一時停止する
- より複雑なN周期形状認識アルゴリズムを開発し,反転信号の精度を向上させる
- 資金管理モジュール導入,口座の純資産の動向に合わせてポジションの規模調整
- 信号の信頼性を高めるため,より多くの時間周期の検証を追加します.
要約する
この戦略は,多次元的な技術指標の協同配合によって,高周波取引における優良な取引機会を模索する.戦略の設計は,トレンド,動力,取引量などの市場特性を十分に考慮し,厳格なリスク管理によって安定性を確保する.ある程度の最適化余地があるが,全体的には論理的に明確で実用的な取引戦略である.
Source
Pine
Strategy parameters
Related strategies
Comment
All comments (0)
No data
- 1