1
フォロー
1750
フォロワー
概要
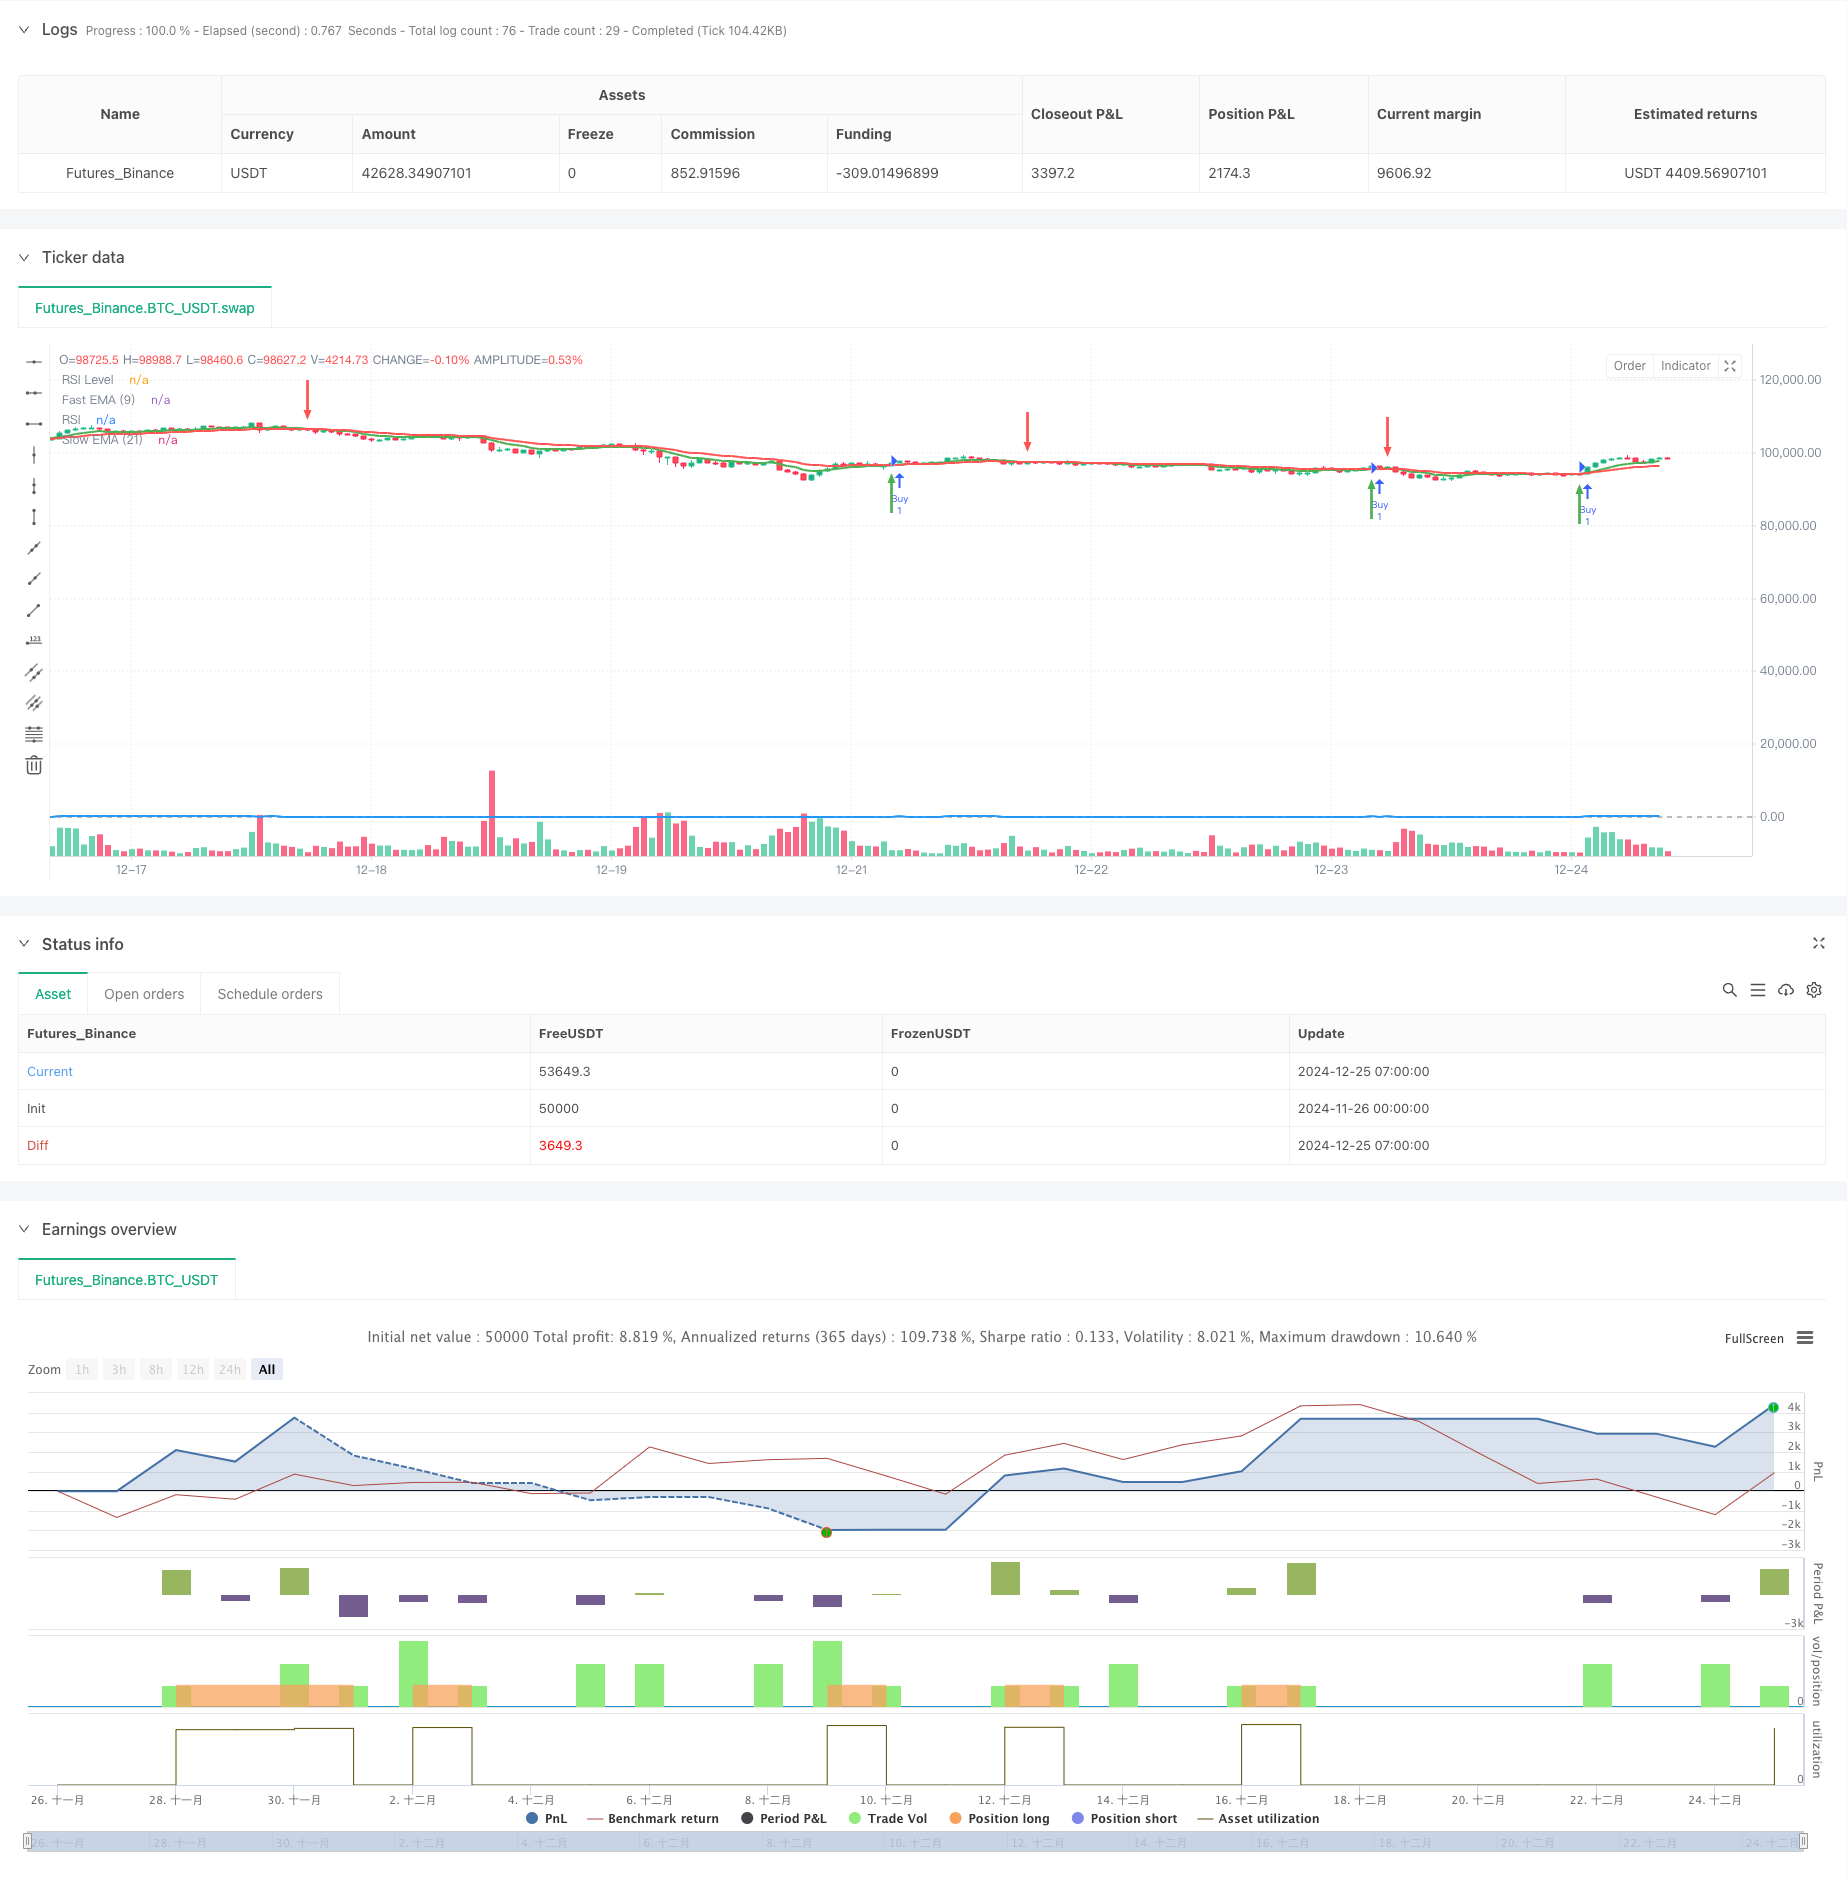
この戦略は,指数移動平均 ((EMA) と比較的強い指標 ((RSI) を組み合わせたトレンド反転取引システムである. 9サイクルと21サイクルEMAの交差信号によって,RSI指標の50レベルでの突破確認と組み合わせて,トレーダーに正確なトレンドの転換点を提供する. システムは,固定ストップ・ストップ・損失比率を含む完全なリスク制御機構を設計し,撤回を効果的に制御する.
戦略原則
戦略のコアロジックは,高速EMA ((9サイクル) と遅いEMA ((21サイクル) の交差に基づいており,RSI指標を使用して動力を確認する. 急速EMAがスローEMAを向上して通過すると,RSIが50より大きいとき,システムは複数の信号を発信する. 急速EMAがスローEMAを下向きに通過すると,RSIが50より小さいとき,システムは平仓信号を発信する.
戦略的優位性
- 双重確認メカニズム:EMAの交差とRSIの確認を組み合わせて,偽信号の確率を大幅に減らす
- 明確な視覚化: 緑色と赤色の矢印で購入と売却の場所を表示し,取引信号は直感的に明確です.
- リスク管理の改善:市場変動に応じてリスク/利益の比率を柔軟に調整できる内蔵の止損機能
- 適応性: 市場環境や取引の種類に合わせて,コアパラメータを調整できる
- 実行の簡素性:取引規則が明確で,自動化取引システムの実現に適しています.
戦略リスク
- 横軸市場には不十分な効果があり,区間変動の際には頻繁に偽信号が生じることがあります.
- 遅滞のリスク:移動平均は遅滞しており,入場の最適なタイミングを逃す可能性があります.
- RSI誤判:極端な状況では,RSI指標は誤導的な信号を生成する可能性があります
- パラメータの感受性:異なる市場環境により,パラメータの調整が必要になり,戦略の維持コストが増加する 解決策:トレンドがはっきりした市場環境で使用することを推奨し,ATR指標を追加して波動率フィルタリングを行い,より長い周期のトレンド判断と組み合わせることができます.
戦略最適化の方向性
- 波動性フィルターの導入:ATRの追加を推奨し,低波動性環境で取引を停止する
- ストップストップの最適化: 追跡ストップまたはATRベースのストップストップの設定のような動的ストップを使用することを考慮することができます.
- トレンド強度フィルターを増やす: より長い周期のトレンド指標を導入し,主トレンドの方向のみで取引する
- 取引量確認の改善: 取引量分析を追加し,信号の信頼性を向上させる.
- 市場環境の分類:異なる市場環境の動向に応じてパラメータを調整して,戦略の適応性を向上させる
要約する
この戦略は,EMAの交差とRSIの動力の確認を組み合わせて,堅牢なトレンド追跡システムを構築しています. 完善したリスク制御機構と明確なビジュアルインタフェースにより,優れた実用性があります.横軸市場でのパフォーマンスはわずかに不足しているものの,推奨された最適化方向によって,戦略の全体的な性能がさらに向上する見込みがあります.
ストラテジーソースコード
/*backtest
start: 2024-11-26 00:00:00
end: 2024-12-25 08:00:00
period: 1h
basePeriod: 1h
exchanges: [{"eid":"Futures_Binance","currency":"BTC_USDT"}]
*/

//@version=5
strategy("EMA Crossover with RSI Confirmation and Buy/Sell Signals", overlay=true)

// Input for EMAs and RSI
fastLength = input.int(9, title="Fast EMA Length")
slowLength = input.int(21, title="Slow EMA Length")
rsiLength = input.int(14, title="RSI Length")
rsiLevel = input.int(50, title="RSI Level", minval=0, maxval=100)

// Calculate the EMAs and RSI
fastEMA = ta.ema(close, fastLength)
slowEMA = ta.ema(close, slowLength)
rsi = ta.rsi(close, rsiLength)

// Plot the EMAs on the chart
plot(fastEMA, color=color.green, linewidth=2, title="Fast EMA (9)")
plot(slowEMA, color=color.red, linewidth=2, title="Slow EMA (21)")

// Plot the RSI on a separate pane (below the chart)
hline(rsiLevel, "RSI Level", color=color.gray)
plot(rsi, color=color.blue, linewidth=2, title="RSI")

// Buy condition: Fast EMA crosses above Slow EMA and RSI crosses above 50
buyCondition = ta.crossover(fastEMA, slowEMA) and rsi > rsiLevel

// Sell condition: Fast EMA crosses below Slow EMA and RSI crosses below 50
sellCondition = ta.crossunder(fastEMA, slowEMA) and rsi < rsiLevel

// Execute trades based on conditions
if (buyCondition)
    strategy.entry("Buy", strategy.long)
    label.new(bar_index, low, "Buy", color=color.green, textcolor=color.white, style=label.style_label_up, size=size.small)

if (sellCondition)
    strategy.close("Buy")
    label.new(bar_index, high, "Sell", color=color.red, textcolor=color.white, style=label.style_label_down, size=size.small)

// Strategy exit (optional): Fixed risk-to-reward ratio (take profit and stop loss)
takeProfit = input.int(2, title="Take Profit (Risk-Reward)", minval=1)
stopLoss = input.int(1, title="Stop Loss (Risk-Reward)", minval=1)

strategy.exit("Exit Buy", "Buy", stop=close * (1 - stopLoss / 100), limit=close * (1 + takeProfit / 100))

// Plot buy/sell arrows for visualization
plotarrow(buyCondition ? 1 : na, offset=-1, colorup=color.green, maxheight=30, title="Buy Signal Arrow")
plotarrow(sellCondition ? -1 : na, offset=-1, colordown=color.red, maxheight=30, title="Sell Signal Arrow")