1
フォロー
1750
フォロワー
概要
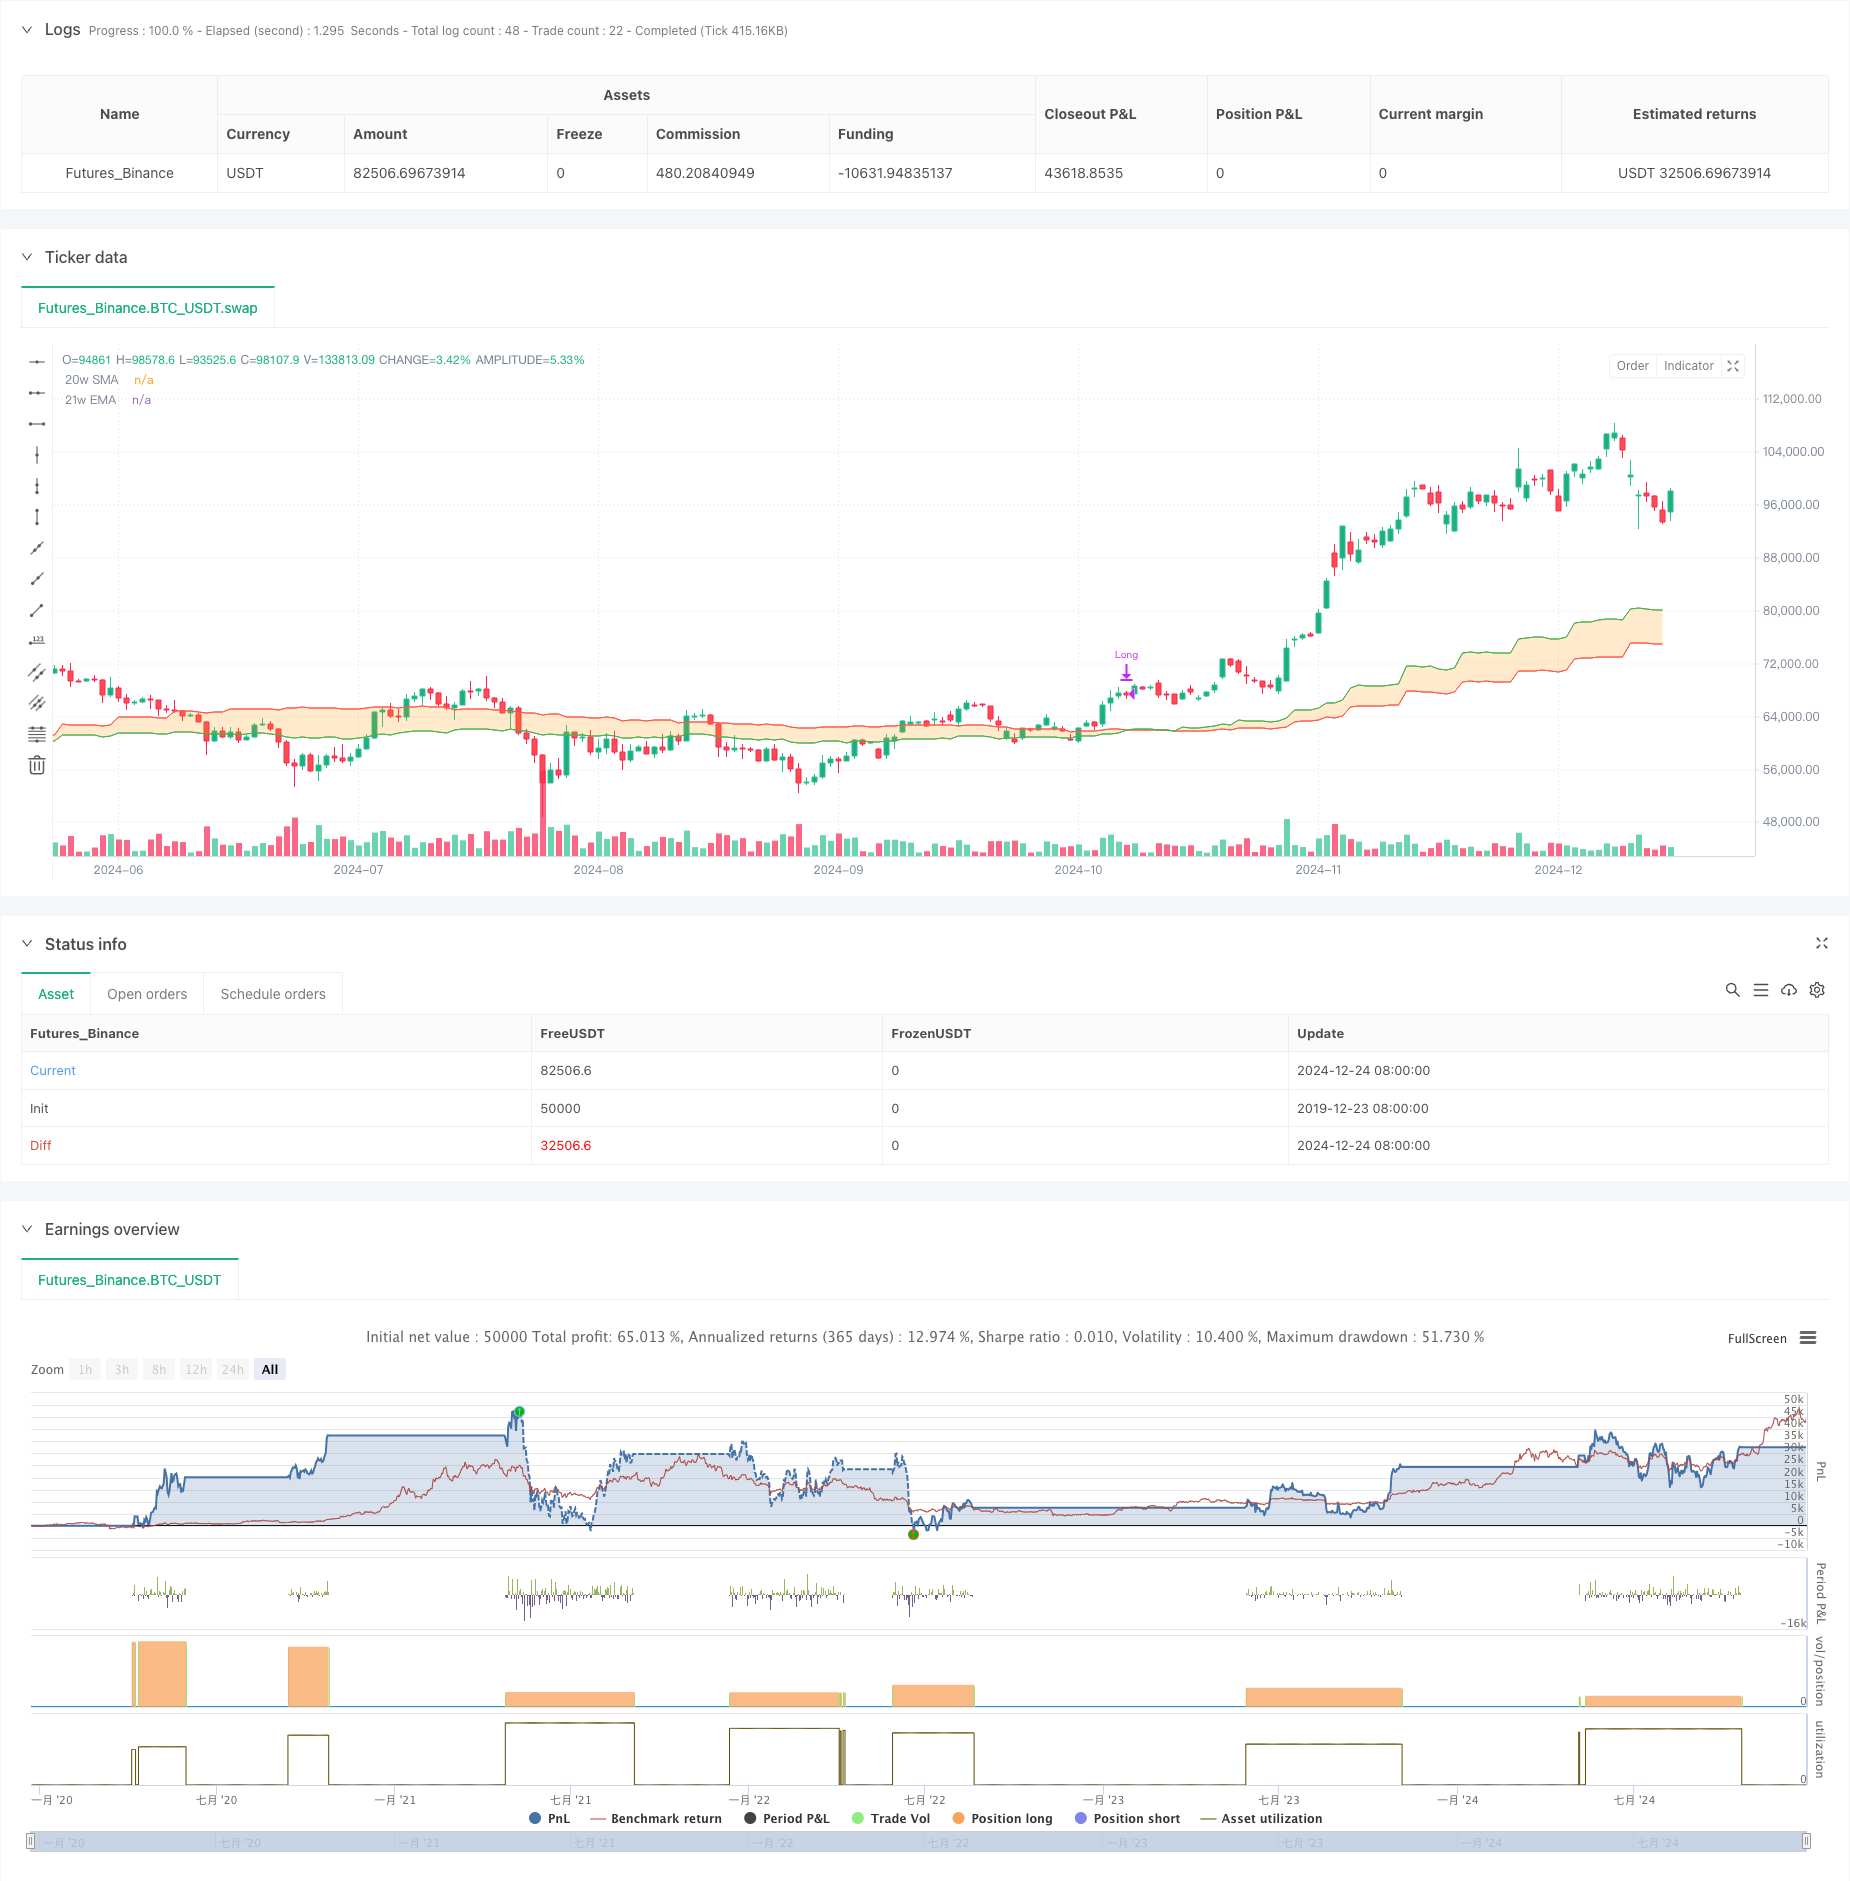
この戦略は,牛市サポート帯 (Bull Market Support Band) に基づくトレンド追跡取引システムである.これは,市場トレンドの方向を決定し,取引決定を行うために,主に20週間の簡易移動平均 (SMA) と21週間のインデックス移動平均 (EMA) の交差信号を使用する.この戦略は,2つの均線が上方交差したとき,より多くの信号を発信し,下方交差したとき,平仓,中長期のトレンドの機会をキャプチャすることによって利益を得る.
戦略原則
戦略の核心的な論理は,20週間のSMAと21週間のEMAの2つの平均線の相対的な位置関係を監視して市場傾向を判断することである.短期平均線 (SMA) が下から長期平均線 (EMA) を突破すると,市場が上昇傾向を形成する可能性を示し,システムはその時にポジションを多く開く.短期平均線が上から上昇傾向が終了する可能性を示し,システムはその時に平仓出場する.戦略は%_of_equityの方法でポジションを管理し,取引手数料を0.1ポイントと設定し,3基点にスライドする.
戦略的優位性
- 強いトレンド追跡力:周回線レベルの均線交差によってトレンドを判断し,短期市場のノイズを効果的にフィルターし,中長期のトレンドの機会を捉える
- 合理的なリスク管理: 動的移動平均をストップ・レファレンスとして使用し,市場が変化する時にタイムリーにオフになる
- パラメータ設定の科学:20週と21週のパラメータ設定は,信号の安定性を保証し,過度の遅延は発生しない
- 実行論理の明晰さ:入場と出場の信号は明瞭で,主観的な判断の要素はありません
- 資金管理の柔軟性:口座の純資産に比例してポジションを開設し,ポジションの規模を動的に調整できる
戦略リスク
- 振動市場には適用されない:横盤振動市場では,平均線が頻繁に交差すると,偽突破が起こり,連続的な損失が発生する
- スライドポイントの影響: 周回線レベルの取引は,実盤で大きなスライドポイントに直面し,戦略のパフォーマンスに影響を与える可能性があります.
- 入場時間遅延:均線交差信号は自然に遅延性があり,最適な入場ポイントを逃す可能性がある
- 撤回制御が不十分: 停止信号として均線交差のみに依存し,激しい波動時に大きな撤回を耐えうる
- 資金要求が高い:周回線レベルの取引は,資金量と心理的負担能力に高い要求がある
戦略最適化の方向性
- フィルタリング指標の追加: RSI,MACDなどの指標を導入してトレンドを確認し,信号の信頼性を向上させる
- オプティマイズされたストップ・メカニズム:ATR指標の設定と動的なストップ・メカニズムを組み合わせて,リスク管理能力を向上させる
- ポジション管理の改善:市場の変動率に合わせてポジションのサイズを動的に調整し,資金管理の改善
- トレンドフィルターを追加: 長期トレンド判断を導入し,主要トレンドの方向のみで取引する
- 取引実行の改善: スライドポイントの影響を軽減し,戦略の安定性を高めるための取引規則の最適化
要約する
牛市支柱帯取引戦略は,古典的技術分析理論に基づくトレンド追跡システムである.周線レベルの均線交差によって,中長期のトレンドの機会を捕捉し,論理的明瞭性,リスクの制御可能な特性を有する.しかし,戦略は,振動的な市場での不良なパフォーマンスを発揮し,ある程度の遅れがある.補助指標を追加し,ストップ・ロズメカニズムを最適化し,資金管理を完善することにより,戦略には大きな最適化余地がある.ある程度の資金規模とリスク承受能力を持つ投資家の使用に適している.
ストラテジーソースコード
/*backtest
start: 2019-12-23 08:00:00
end: 2024-12-25 08:00:00
period: 1d
basePeriod: 1d
exchanges: [{"eid":"Futures_Binance","currency":"BTC_USDT"}]
*/

// This source code is subject to the terms of the Mozilla Public License 2.0
// © zkdev

//@version=6
strategy(title='Demo GPT - Bull Market Support Band',
     overlay=true,
     default_qty_type=strategy.percent_of_equity,
     default_qty_value=100,
     commission_type=strategy.commission.percent,
     commission_value=0.1,
     slippage=3)

// -------------------------------------------------------------------------
// Compile-time timestamp constants for default date range
// (2018-01-01 00:00:00 UTC -> 1514764800000
//  2069-12-31 23:59:59 UTC -> 3155759999000)
// -------------------------------------------------------------------------
const int defaultFromDate = 1514764800000
const int defaultToDate   = 3155759999000

// -------------------------------------------------------------------------
// Inputs: date range
// -------------------------------------------------------------------------
fromDate = input(title='Start Date', defval=defaultFromDate)
toDate   = input(title='End Date',   defval=defaultToDate)

// -------------------------------------------------------------------------
// Indicator settings & calculations
// -------------------------------------------------------------------------
smaLength = 20
emaLength = 21

source = close
sma    = ta.sma(source, smaLength)
ema    = ta.ema(source, emaLength)

// -------------------------------------------------------------------------
// Fetch weekly SMA & EMA
// -------------------------------------------------------------------------
outSma = request.security(syminfo.tickerid, 'W', sma, gaps=barmerge.gaps_on, lookahead=barmerge.lookahead_off)
outEma = request.security(syminfo.tickerid, 'W', ema, gaps=barmerge.gaps_on, lookahead=barmerge.lookahead_off)

// -------------------------------------------------------------------------
// Plot visuals (20w SMA, 21w EMA, fill in between)
// -------------------------------------------------------------------------
smaPlot = plot(outSma, color=color.new(color.red,   0), title='20w SMA')
emaPlot = plot(outEma, color=color.new(color.green, 0), title='21w EMA')
fill(smaPlot, emaPlot, color=color.new(color.orange, 75), fillgaps=true)

// -------------------------------------------------------------------------
// We evaluate crossover/crossunder on *every bar* and store the result
// -------------------------------------------------------------------------
crossUp   = ta.crossover(outSma, outEma)
crossDown = ta.crossunder(outSma, outEma)

// -------------------------------------------------------------------------
// Trade logic: only operate within chosen date range
// Buy when outSma crosses above outEma; Sell (close) when outSma crosses below outEma
// -------------------------------------------------------------------------
inDateRange = true

if inDateRange
    // If we have a crossUp event on this bar, buy (go Long)
    if crossUp
        strategy.entry('Long', strategy.long)

    // If we have a crossDown event on this bar, sell (close Long)
    if crossDown
        strategy.close('Long')