正規化された対数収益に基づく適応型動的取引戦略

SZI SMA LOG STD
作成日: 2024-12-27 14:39:32 最終変更日: 2024-12-27 14:39:32
コピー: 2 クリック数: 376
1
フォロー
1617
フォロワー

正規化された対数収益に基づく適応型動的取引戦略

概要

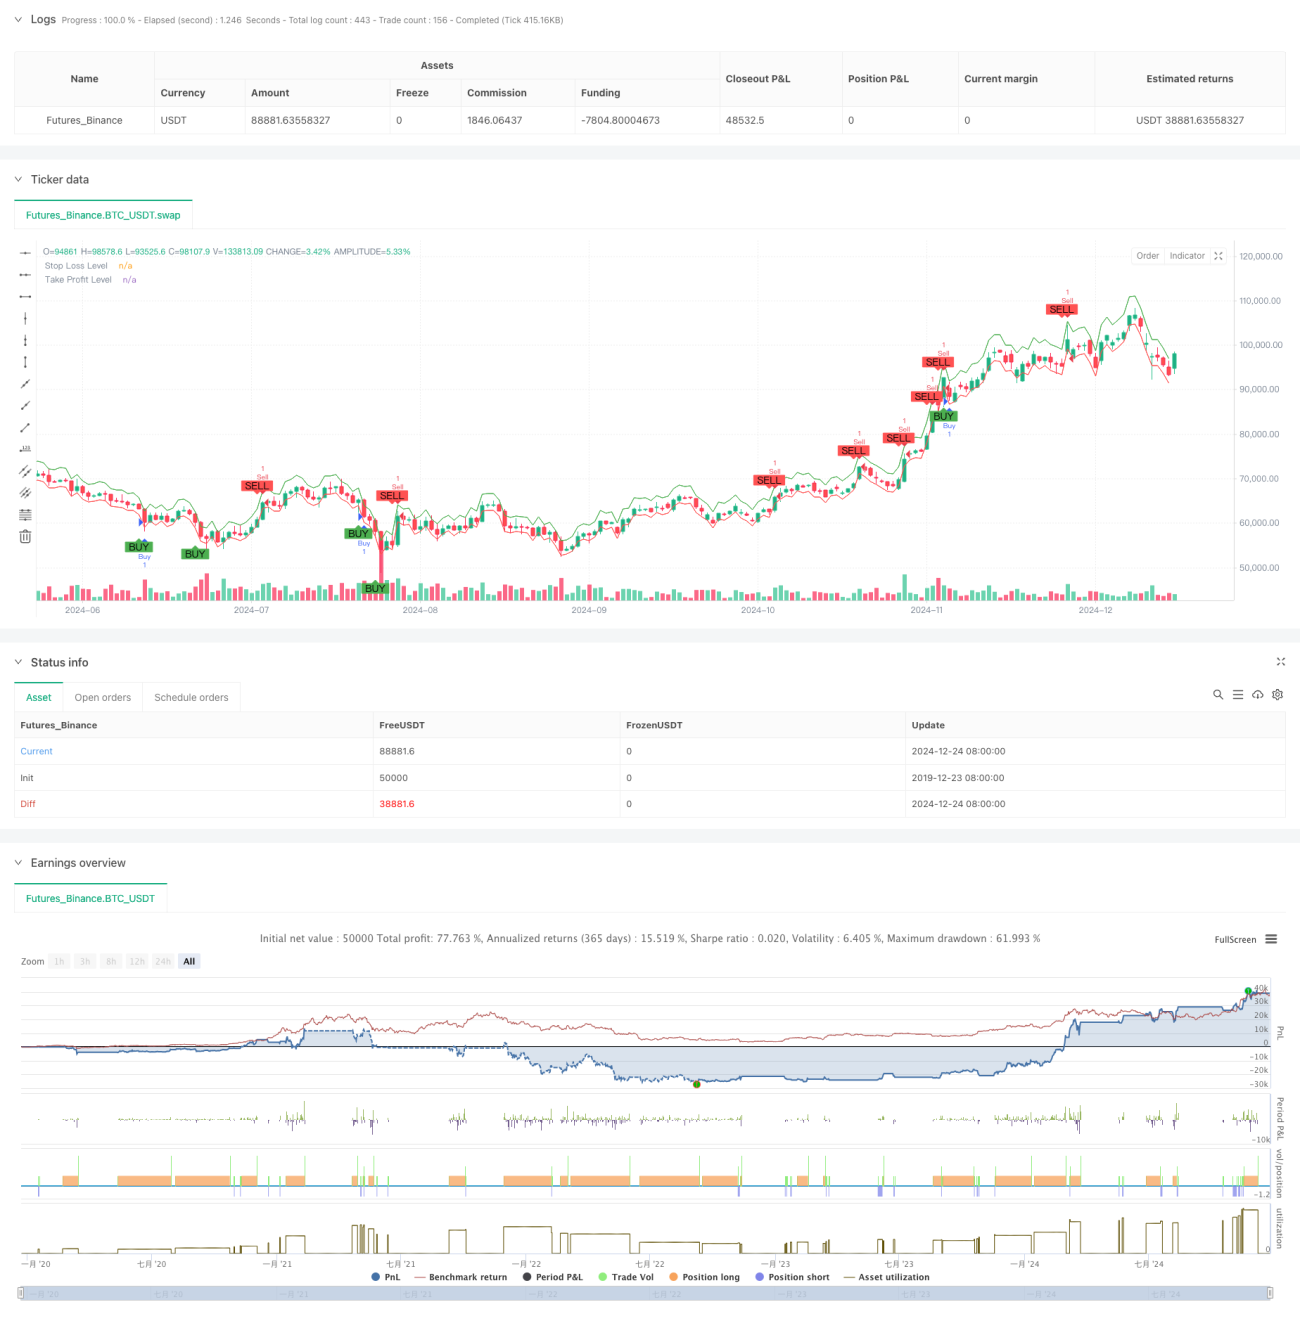
この戦略はShiryaev-Zhou指数 (SZI) に基づく自適化取引システムである.これは対数リターン率の標準化されたスコアを計算して市場の過買と過売状態を識別し,価格の平均値回帰の機会を捕捉する.この戦略は,ダイナミックな止損と利益の目標を組み合わせ,リスクを精密に制御する.

戦略原則

戦略の核心は,対数リターン率のローリング統計特性を用いて標準化指標を構築することである.具体的ステップは以下の通りである.

  1. 対数回益率を計算し,回益率の正規化処理を実現する
  2. 50周期ウィンドウを使用して移動平均と標準差を計算する
  3. SZI指標の構築: (対数リターン - ローリング平均) /ローリング標準差
  4. SZIは,-2.0を下回ると多行信号,2.0上回ると空白信号を生成する
  5. 入場価格に基づいて2%のストップ・ロズと4%のストップ・ストップレベルを設定する

戦略的優位性

  1. 理論の基礎は堅牢である:対数正規分布の仮定に基づいて,統計学的に良好な支持がある
  2. 柔軟性: 市場波動特性の変化に適応するロールウィンドウ計算
  3. リスクコントロールの完善: パーセンテージ・ストップ・ストラトジーを採用し,各取引のリスクを精密に制御する
  4. ビジュアルフレンドリー:取引信号とリスク管理レベルをグラフで明確に表示する

戦略リスク

  1. パラメータの感受性:スクロールウィンドウの長さや値の選択は,戦略のパフォーマンスに大きく影響する
  2. 市場環境依存性:トレンド市場では頻繁に誤った信号が生じる可能性
  3. スライドポイントの影響: 激しい波動期に,実際の取引価格が理想的なレベルから大きく逸脱する可能性がある
  4. 計算遅延:リアルタイムで計算される統計指標は,一定の信号遅延を生じることがあります.

戦略最適化の方向性

  1. 動的値:市場の変動率に動的に調整するシグナル値を検討できる
  2. 多時間周期:複数の時間周期を導入した信号確認機構
  3. 波動率フィルター: 極端な波動期間の取引を一時停止またはポジション調整
  4. 信号確認: 交差量,動量などの補助指標を信号確認する
  5. ポジション管理:変動率に基づく動的ポジション管理を実現

要約する

これは,堅固な統計学に基づいた定量取引戦略であり,標準化された対数収益によって価格変動の機会を捉えます.この戦略の主要な優点は,自律的適応性と優れたリスク管理にありますが,パラメータ選択と市場環境への適応性に関して最適化の余地があります.ダイナミックな減值と多次元信号確認メカニズムを導入することにより,戦略の安定性と信頼性がさらに向上する見込みがあります.

ストラテジーソースコード
/*backtest
start: 2019-12-23 08:00:00
end: 2024-12-25 08:00:00
period: 1d
basePeriod: 1d
exchanges: [{"eid":"Futures_Binance","currency":"BTC_USDT"}]
*/

//@version=5
strategy("Jalambi Paul model", overlay=true)

// Define the length for the rolling window
window = input.int(50, title="Window Length", minval=1)
threshold = 2.0 // Fixed threshold value
risk_percentage = input.float(1.0, title="Risk Percentage per Trade", step=0.1) / 100

// Calculate the logarithmic returns
log_return = math.log(close / close[1])

// Calculate the rolling mean and standard deviation
rolling_mean = ta.sma(log_return, window)
rolling_std = ta.stdev(log_return, window)

// Calculate the Shiryaev-Zhou Index (SZI)
SZI = (log_return - rolling_mean) / rolling_std

// Generate signals based on the fixed threshold
long_signal = SZI < -threshold
short_signal = SZI > threshold

// Plot the signals on the main chart (overlay on price)
plotshape(series=long_signal, location=location.belowbar, color=color.green, style=shape.labelup, title="Buy Signal", text="BUY", offset=-1)
plotshape(series=short_signal, location=location.abovebar, color=color.red, style=shape.labeldown, title="Sell Signal", text="SELL", offset=-1)

// Strategy logic: Buy when SZI crosses below the negative threshold, Sell when it crosses above the positive threshold
if (long_signal)
    strategy.entry("Buy", strategy.long, comment="Long Entry")
    
if (short_signal)
    strategy.entry("Sell", strategy.short, comment="Short Entry")

// Calculate the stop loss and take profit levels based on the percentage of risk
stop_loss_pct = input.float(2.0, title="Stop Loss (%)") / 100
take_profit_pct = input.float(4.0, title="Take Profit (%)") / 100

// Set the stop loss and take profit levels based on the entry price
strategy.exit("Take Profit / Stop Loss", "Buy", stop=close * (1 - stop_loss_pct), limit=close * (1 + take_profit_pct))
strategy.exit("Take Profit / Stop Loss", "Sell", stop=close * (1 + stop_loss_pct), limit=close * (1 - take_profit_pct))

// Plot the stop loss and take profit levels for visualization (optional)
plot(stop_loss_pct != 0 ? close * (1 - stop_loss_pct) : na, color=color.red, linewidth=1, title="Stop Loss Level")
plot(take_profit_pct != 0 ? close * (1 + take_profit_pct) : na, color=color.green, linewidth=1, title="Take Profit Level")