
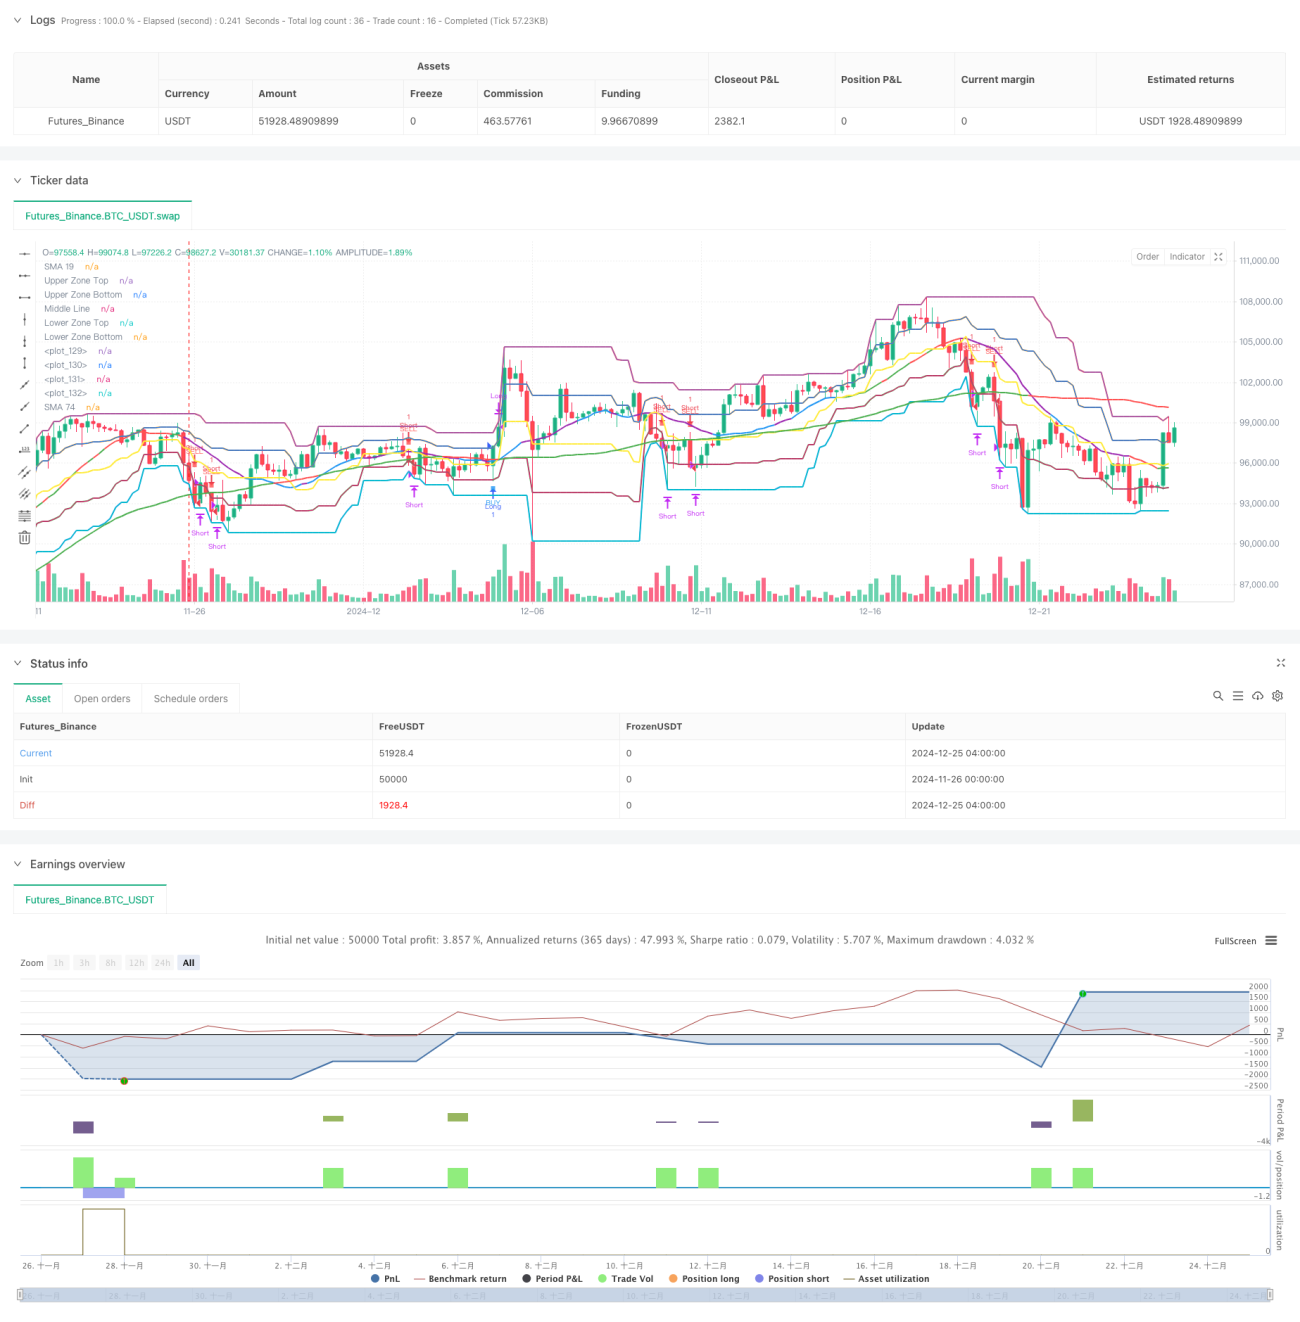
この戦略は,複数の移動平均 ((SMA) とランダムな指標 ((KDJ) を組み合わせたトレンド追跡取引システムである.価格区間とトレンド判断条件を設定し,市場傾向が明確であるときに取引を行う.戦略は,市場動向に応じてポジション管理を調整するダイナミック・ストップ・ロスの仕組みを採用し,利潤を保護し,また早めに退場しない.
この戦略は、次のコアコンポーネントに基づいています。
この戦略は,複数の技術指標を組み合わせて,完ぺきな取引システムを構築し,良好なトレンド追跡能力とリスク管理機構を有している.特定の市場環境下では課題に直面する可能性があるが,継続的な最適化と完善によって,戦略は,異なる市場環境下でも安定したパフォーマンスを維持する見込みがある.
/*backtest
start: 2024-11-26 00:00:00
end: 2024-12-25 08:00:00
period: 4h
basePeriod: 4h
exchanges: [{"eid":"Futures_Binance","currency":"BTC_USDT"}]
*/
//@version=5
strategy("Purple SMA Strategy", overlay=true)
// === INPUTS ===
zoneLength = input.int(20, "Price Zone Length", minval=5)
tickSize = input.float(1.0, "Tick Size for Hard Stop")
hardStopTicks = input.int(50, "Hard Stop Loss in Ticks")
// === CALCULATE ZONES ===
h = ta.highest(high, zoneLength)
l = ta.lowest(low, zoneLength)
priceRange = h - l
lvl5 = h
lvl4 = l + (priceRange * 0.75) // Orange line
lvl3 = l + (priceRange * 0.50) // Yellow line
lvl2 = l + (priceRange * 0.25) // Green line
lvl1 = l
// === INDICATORS ===
sma19 = ta.sma(close, 19)
sma74 = ta.sma(close, 74)
// === CANDLE COLOR CONDITIONS ===
isGreenCandle = close > open
isRedCandle = close < open
// === CONTINUOUS TREND DETECTION ===
isThreeGreenCandles = close > open and close[1] > open[1] and close[2] > open[2]
isThreeRedCandles = close < open and close[1] < open[1] and close[2] < open[2]
var bool inGreenTrend = false
var bool inRedTrend = false
// Update trends
if isThreeGreenCandles
inGreenTrend := true
inRedTrend := false
if isThreeRedCandles
inRedTrend := true
inGreenTrend := false
if (inGreenTrend and isRedCandle) or (inRedTrend and isGreenCandle)
inGreenTrend := false
inRedTrend := false
// === STOCHASTIC CONDITIONS ===
k = ta.stoch(close, high, low, 60)
d = ta.sma(k, 10)
isOverbought = d >= 80
isOversold = d <= 20
stochUp = d > d[1]
stochDown = d < d[1]
// === SMA COLOR LOGIC ===
sma19Color = if isOverbought and stochUp
color.green
else if isOverbought and stochDown
color.red
else if isOversold and stochUp
color.green
else if isOversold and stochDown
color.red
else if stochUp
color.blue
else if stochDown
color.purple
else
color.gray
sma74Color = sma74 < sma19 ? color.green : color.red
// === CROSSING CONDITIONS ===
crossUpSMA = ta.crossover(close, sma74)
crossDownSMA = ta.crossunder(close, sma74)
// === ENTRY CONDITIONS ===
buyCondition = crossUpSMA and close > lvl4
sellCondition = crossDownSMA and close < lvl2
// === POSITION MANAGEMENT ===
var float stopLevel = na
var bool xMode = false
// Entry and Stop Loss
if buyCondition
strategy.entry(id="Long", direction=strategy.long)
stopLevel := close - (hardStopTicks * tickSize)
xMode := false
if sellCondition
strategy.entry(id="Short", direction=strategy.short)
stopLevel := close + (hardStopTicks * tickSize)
xMode := false
// Update stops based on X's
if strategy.position_size != 0 and (inGreenTrend or inRedTrend)
xMode := true
if strategy.position_size > 0 // Long position
stopLevel := low
else // Short position
stopLevel := high
// Exit logic
if strategy.position_size > 0 // Long position
if low <= stopLevel
strategy.close(id="Long")
else if xMode and not (inGreenTrend or inRedTrend)
strategy.close(id="Long")
if strategy.position_size < 0 // Short position
if high >= stopLevel
strategy.close(id="Short")
else if xMode and not (inGreenTrend or inRedTrend)
strategy.close(id="Short")
// === PLOTTING ===
plot(sma19, "SMA 19", color=sma19Color, linewidth=2)
plot(sma74, "SMA 74", color=sma74Color, linewidth=2)
plot(lvl5, "Upper Zone Top", color=color.red, linewidth=2)
plot(lvl4, "Upper Zone Bottom", color=color.orange, linewidth=2)
plot(lvl3, "Middle Line", color=color.yellow, linewidth=2)
plot(lvl2, "Lower Zone Top", color=color.green, linewidth=2)
plot(lvl1, "Lower Zone Bottom", color=color.blue, linewidth=2)
// Plot X signals
plotshape(inGreenTrend, title="Bullish Line", style=shape.xcross, location=location.belowbar, color=color.white, size=size.tiny)
plotshape(inRedTrend, title="Bearish Line", style=shape.xcross, location=location.abovebar, color=color.white, size=size.tiny)
// Zone fills
var p1 = plot(lvl5, display=display.none)
var p2 = plot(lvl4, display=display.none)
var p3 = plot(lvl2, display=display.none)
var p4 = plot(lvl1, display=display.none)
fill(p1, p2, color=color.new(color.red, 90))
fill(p3, p4, color=color.new(color.green, 90))
// Plot entry signals
plotshape(buyCondition, title="Buy", style=shape.square, location=location.belowbar, color=color.new(color.blue, 20), size=size.tiny, text="BUY", textcolor=color.blue)
plotshape(sellCondition, title="Sell", style=shape.square, location=location.abovebar, color=color.new(color.red, 20), size=size.tiny, text="SELL", textcolor=color.red)