ATRストップロスと取引範囲制御に基づくRSIトレンド反転取引戦略

1
Follow
1781
Followers
概要
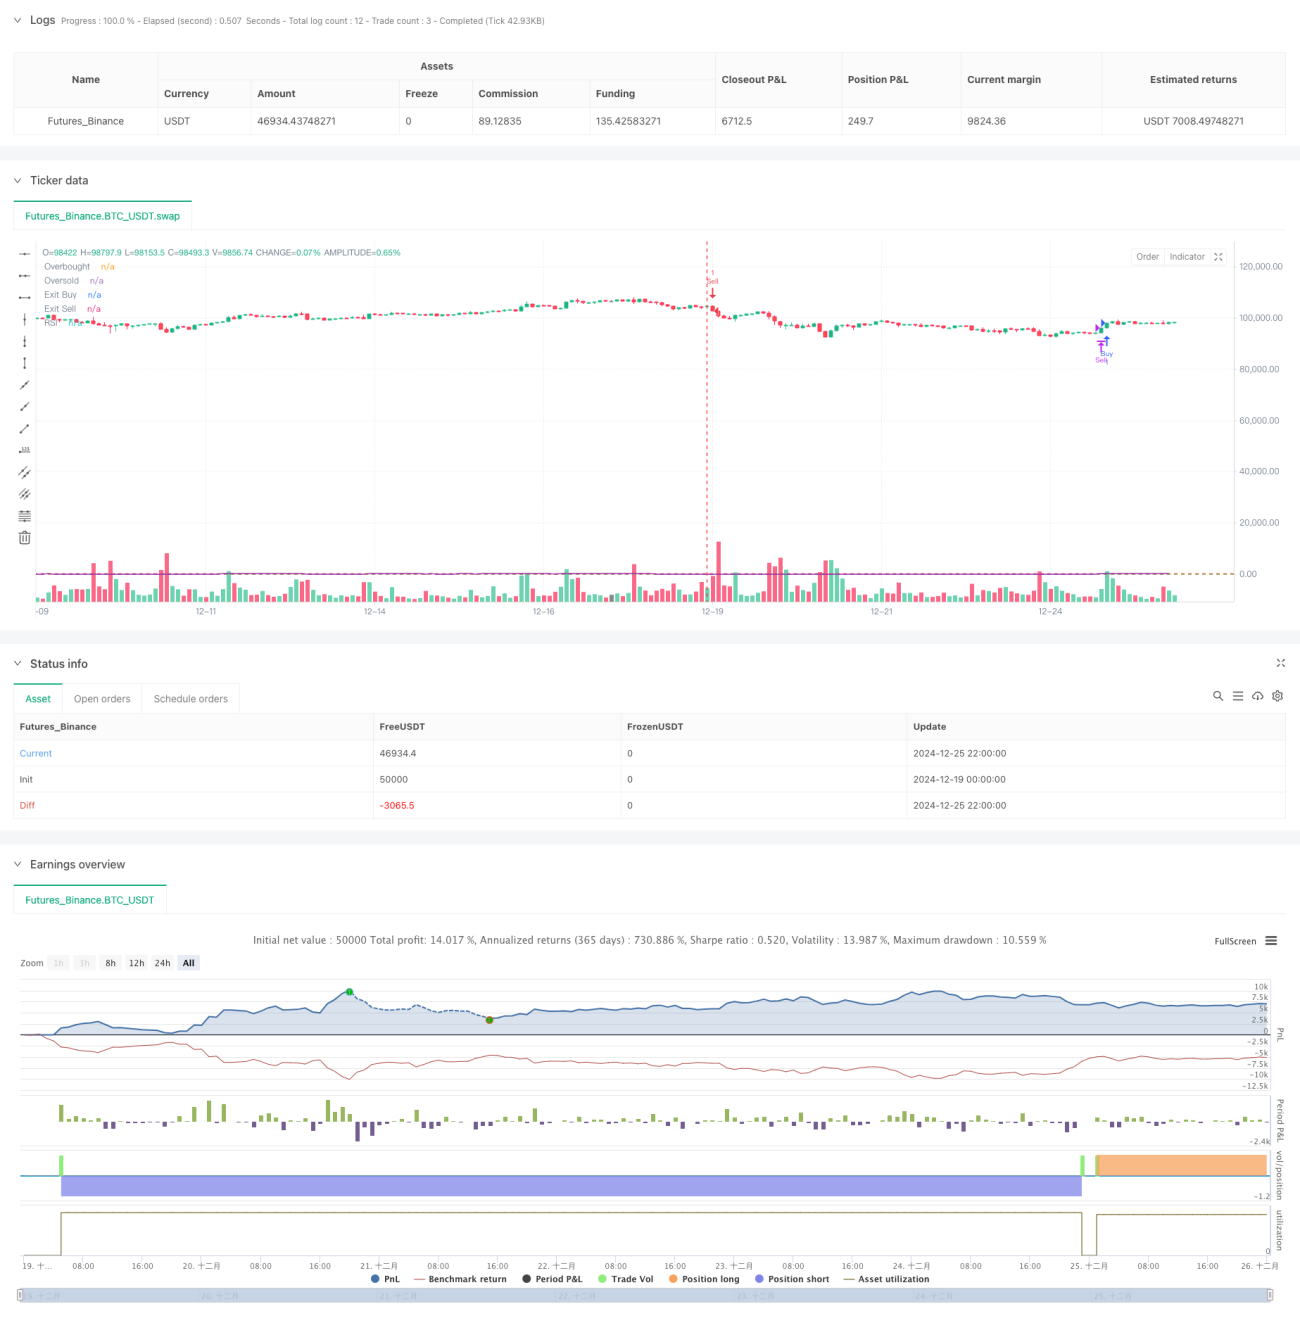
この戦略は、相対力指数 (RSI) に基づいたトレンド反転取引システムです。買われすぎと売られすぎの範囲を設定することで市場の転換点を捉え、ATR ダイナミック ストップ ロスを組み合わせてリスクを管理します。この戦略のユニークさは、「禁止取引範囲」という概念を導入したことにあり、これにより、変動の激しい市場での頻繁な取引を効果的に回避できます。この戦略は、ボラティリティの高い市場環境、特に明らかなトレンド特性を持つ商品の取引に適しています。
戦略原則
この戦略は主に以下のコアロジックに基づいています。
- 14期間RSIインジケーターを使用して買われ過ぎと売られ過ぎの市場状況を特定する
- RSI が 60 レベルを突破し、終値が前回の高値よりも高くなると、ロング シグナルがトリガーされます。
- RSI が 40 レベルを下回り、終値が前回の安値よりも低い場合、ショート シグナルがトリガーされます。
- RSIが45〜55の範囲にある場合、統合フェーズでの頻繁な取引を防ぐために禁止取引ゾーンとして設定されます。
- リスク管理メカニズムを提供するために、ATRの1.5倍に基づいて動的なストップロスを設定します。
- RSIがそれぞれ45以下と55以上の場合は、ロングポジションとショートポジションをクローズします。
戦略的優位性
- トレンド反転とモメンタム特性を組み合わせて取引を決定する
- 取引範囲を禁止することで、変動の激しい市場での誤ったシグナルを効果的に回避します。
- ATRダイナミックストップロスを採用し、市場のボラティリティに応じてストップロスポジションを適応的に調整します。
- 主観的な判断を避けるための明確な参入条件と退出条件
- 戦略ロジックはシンプルで明確であり、理解しやすく維持しやすい
- 優れたリスク管理メカニズムを備える
戦略リスク
- 急速なトレンドの市場ではいくつかの動きを見逃す可能性がある
- RSIインジケーターには遅れがあるため、エントリーのタイミングが若干遅れる可能性がある。
- 取引範囲を禁止すると、重要な取引機会を逃す可能性がある。
- ATRストップロスは、ボラティリティの高い期間にストップロスが広くなりすぎる可能性があります。
- さまざまな市場環境に適応するためには、適切なパラメータを設定する必要がある
戦略最適化の方向性
- 取引の信頼性を向上させるために、複数期間のRSI確認シグナルを導入
- 補助的な判断条件としてボリューム指標を追加する
- 禁止取引範囲の動的調整メカニズムを最適化する
- 強いトレンドで戦略パラメータを調整するためのトレンドスクリーニング機能の追加を検討してください
- 戦略の適応性を向上させる適応型パラメータ最適化メカニズムを開発する
- 資本利用効率を向上させるために利益確定メカニズムを追加する
要約する
この戦略は、RSI 反転シグナルと禁止取引範囲の革新的な組み合わせを通じて、トレンド取引におけるタイミングの問題を解決します。 ATR ダイナミック ストップ ロスの導入により、戦略に信頼性の高いリスク管理メカニズムが提供されます。この戦略には依然として潜在的なリスクが残っていますが、推奨される最適化の方向性を通じて、戦略の安定性と収益性をさらに向上させることができます。全体として、これは明確なロジックと強力な実用性を備えたトレンド反転取引戦略です。
Source
Pine
Strategy parameters
Related strategies
Comment
All comments (0)
No data
- 1