
概要
この戦略は、スーパートレンド インジケーターとカウフマン適応移動平均 (KAMA) を組み合わせたトレンド フォロー トレーディング システムです。この戦略は、市場トレンドの変化を動的に識別し、上昇トレンドにおける長期的な機会を探し、柔軟なストップロスメカニズムを使用してリスクを制御します。この戦略の核となる考え方は、スーパートレンド指標のトレンド方向判断能力と、市場変動に対するKAMA指標の適応特性を組み合わせて、市場の上昇トレンドでロングポジションを確立することです。
戦略原則
この戦略では、デュアルテクニカル指標確認システムを使用します。まず、スーパートレンド インジケーターは、ATR とカスタム係数を使用してトレンドの方向を計算します。インジケーターの線が価格より下にある場合、上昇トレンドを示します。第二に、KAMA インジケーターは適応メカニズムを通じて移動平均の感度を調整し、さまざまな市場環境により適応できるようになります。エントリーシグナルは、スーパートレンドが上昇トレンドを示し、価格が KAMA ラインを上回っているという 2 つの条件を同時に満たす必要があります。同様に、終了シグナルも二重の確認が必要です。スーパートレンドが下降トレンドに変わり、価格が KAMA ラインを下回ります。この二重確認メカニズムにより、誤った信号の影響が効果的に軽減されます。
戦略的優位性
- 信号の信頼性を向上させるために、デュアルテクニカル指標確認メカニズムを採用
- KAMA インジケーターは適応特性を持ち、市場の変動に応じて感度を調整できます。
- スーパートレンドインジケーターはトレンドの方向を明確に示します
- 完璧なストップロスメカニズムを備えており、リスクを効果的に制御できます。
- 戦略ロジックは明確で、パラメータは高度に調整可能です
- エントリーとエグジットのシグナルは明確で実行しやすい
戦略リスク
- 不安定な市場では取引シグナルが頻繁に発生し、取引コストが増加する可能性がある。
- トレンド反転の初期段階では遅れが生じる可能性があり、それがストップロス効果に影響を与える可能性がある。
- 不適切なパラメータ選択は過敏症または無敏症につながる可能性がある
- 市場が急激に変動すると大きなスリッページが発生する可能性があります
- 取引コストとスリッページは戦略全体のリターンに影響を与える可能性がある
戦略最適化の方向性
- ボラティリティが高い期間にパラメータを調整したり取引を一時停止したりするボラティリティフィルターメカニズムを導入
- 補助確認としてボリュームインジケーターを追加
- ストップロスメカニズムを最適化し、トレーリングストップロスの使用を検討する
- 戦略が適用可能な市場環境の判断力を高める
- 特定の時間帯の取引を回避するために時間フィルタリングを追加する
- 適応型パラメータ最適化システムの開発
要約する
この戦略は、Supertrend と KAMA という 2 つのテクニカル指標を組み合わせて、強力なトレンド追従型取引システムを構築します。この戦略の主な利点は、適応性とリスク管理能力であり、二重確認メカニズムによって取引シグナルの信頼性が向上します。不安定な市場ではいくつかの課題があるかもしれませんが、適切なパラメータ設定と最適化の方向性の実装により、戦略の全体的なパフォーマンスをさらに向上させることができます。この戦略は、中期および長期のトレンド取引に特に適しており、明確なトレンドのある市場環境でより良いパフォーマンスを発揮します。
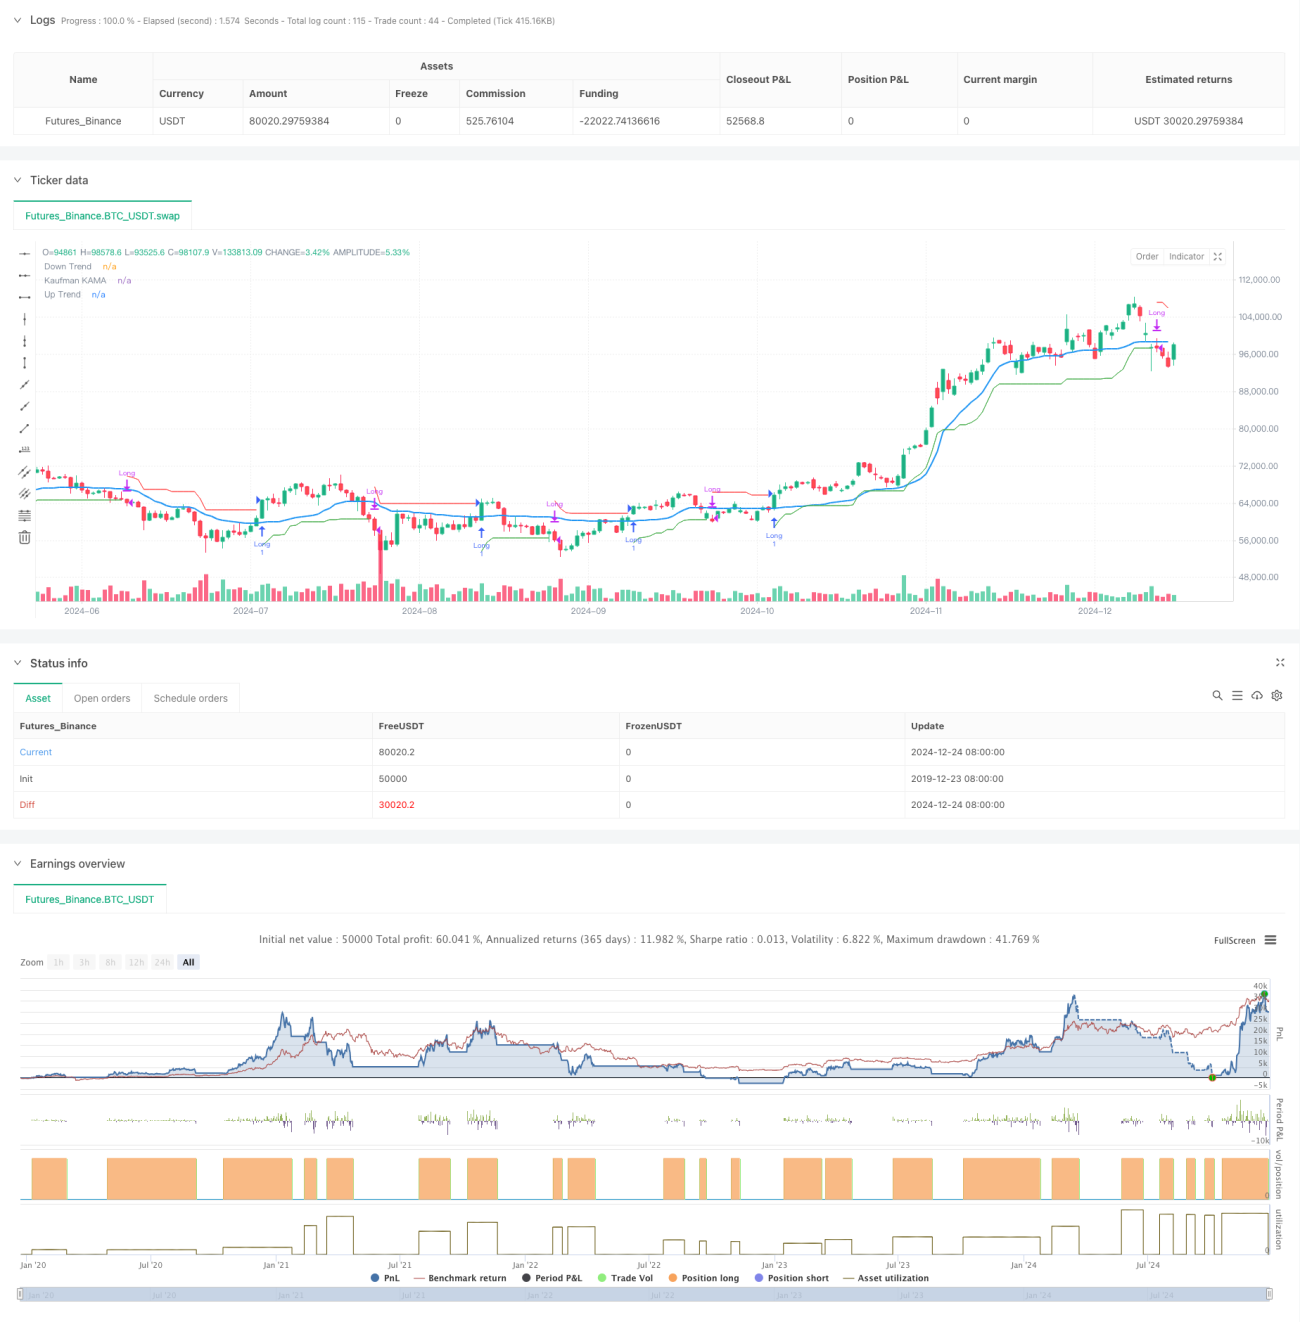
/*backtest
start: 2019-12-23 08:00:00
end: 2024-12-25 08:00:00
period: 1d
basePeriod: 1d
exchanges: [{"eid":"Futures_Binance","currency":"BTC_USDT"}]
*/

//@version=6
strategy("Supertrend + KAMA Long Strategy", overlay=true, commission_type=strategy.commission.percent, commission_value=0.1, slippage=3)

// User-defined inputs for date range- 1