
この戦略は、15 分間の時間枠に基づく高頻度取引戦略です。この戦略は、指数移動平均(EMA)、相対力指数(RSI)、平均方向指数(ADX)、平均真の範囲(ATR)などの複数のテクニカル指標を組み合わせ、これらの指標の相乗効果を通じて取引シグナルを実現します。正確なキャプチャリスクの動的な管理。この戦略は明確な視覚的デザインを採用しており、トレーダーが市場の状況や取引シグナルをリアルタイムで簡単に監視できます。
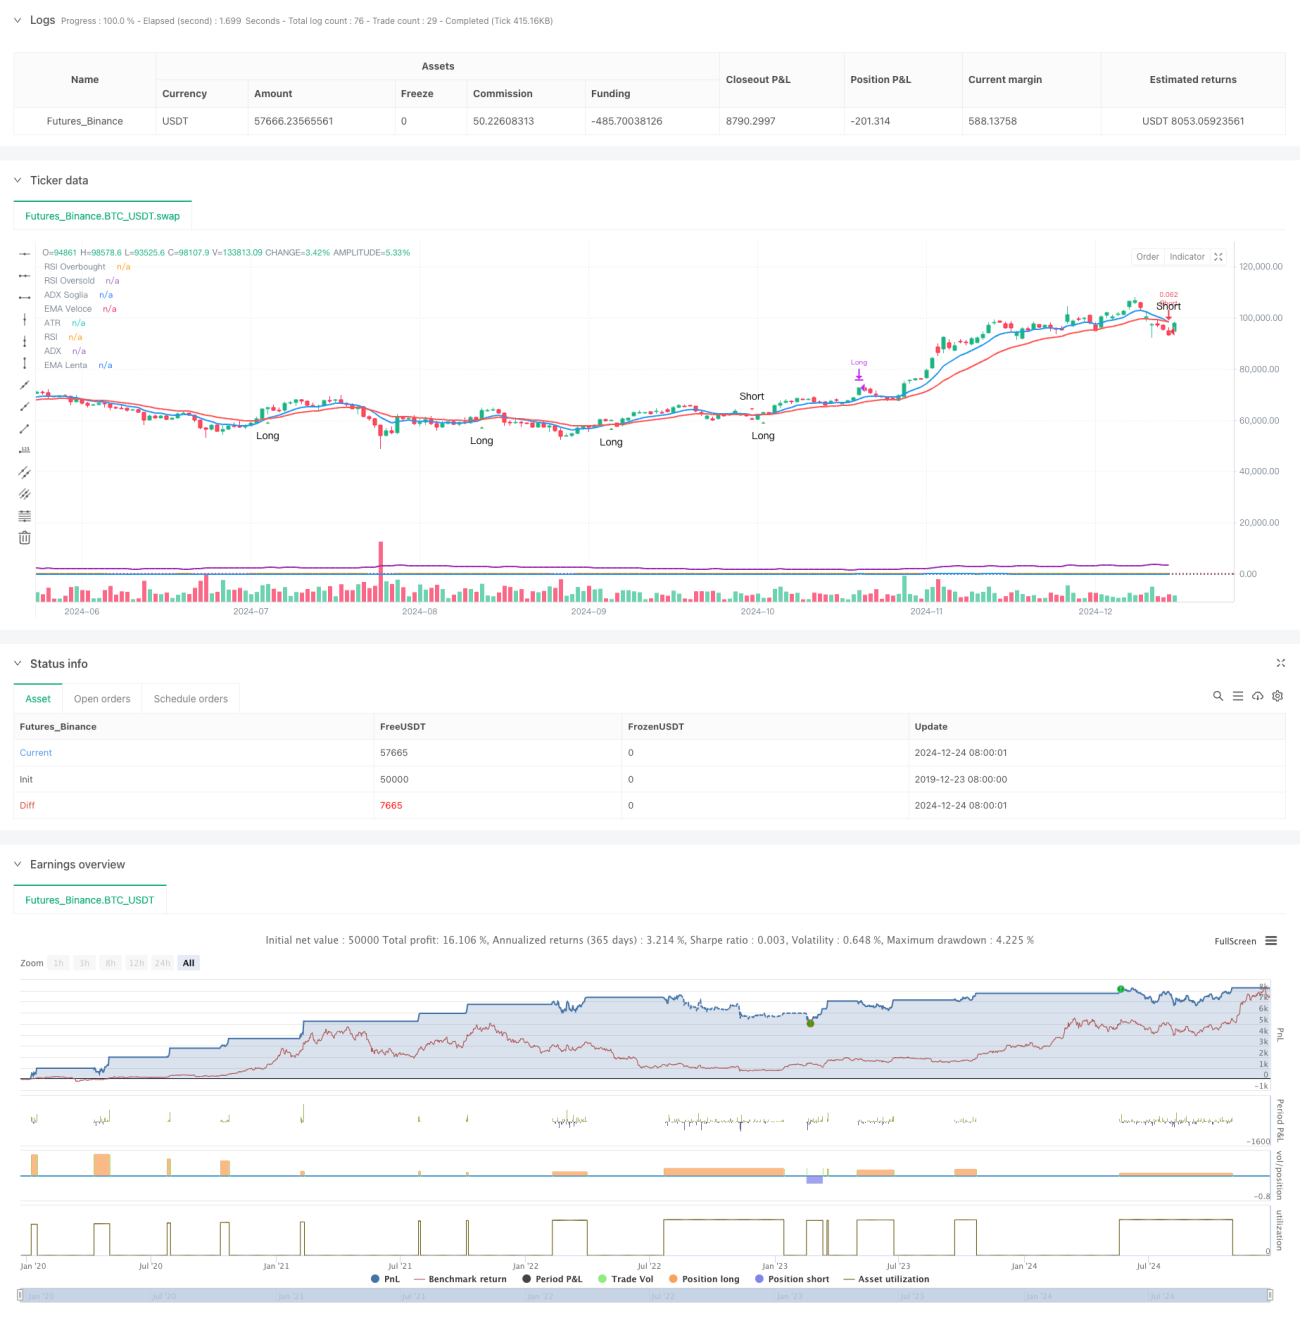
この戦略のコアロジックは、高速 EMA (9 期間) と低速 EMA (21 期間) のクロスオーバーに基づいて取引シグナルを生成することです。 RSI(14期間)は売られすぎ領域をフィルタリングするために使用され、ADX(14期間)はトレンドの強さを確認するために使用され、ATR(14期間)はストップロスと利益目標を動的に設定するために使用されます。複数のテクニカル指標を組み合わせることで、取引シグナルの信頼性が確保されます。エントリー条件は次のとおりです。ロング – 高速EMAが低速EMAを上回り、RSIが70未満、ADXが20を超える。ショート – 高速EMAが低速EMAを下回り、RSIが30を超え、ADXが20. Exit では、ATR に基づいて動的なストップ ロスと利益目標設定が使用されます。
この戦略は、複数のテクニカル指標の相乗効果を通じて、高頻度取引におけるシグナルキャプチャとリスク管理のバランスを実現します。明確なビジュアルデザインと完全な自動化サポートにより、より実用的になります。リスク管理の継続的な最適化と改善を通じて、この戦略はさまざまな市場環境において安定したパフォーマンスを維持することが期待されます。一定のリスクはありますが、これらのリスクは、適切なパラメータ設定とリスク管理対策によって制御可能です。この戦略を成功させるには、トレーダーが市場を深く理解し、常にリスクに焦点を当て続ける必要があります。
/*backtest
start: 2019-12-23 08:00:00
end: 2024-12-25 08:00:00
period: 1d
basePeriod: 1d
exchanges: [{"eid":"Futures_Binance","currency":"BTC_USDT"}]
*/
//@version=5
strategy("Scalping BTC Ottimizzato - Grafica Chiara", shorttitle="Scalp BTC Opt", overlay=true, default_qty_type=strategy.percent_of_equity, default_qty_value=10)
// === 📊 INPUTS ===
// 📈 Medie Mobili
emaFastLength = input.int(9, title="EMA Veloce", minval=1)
emaSlowLength = input.int(21, title="EMA Lenta", minval=1)
// 💡 RSI
rsiLength = input.int(14, title="RSI Length", minval=1)
rsiOverbought = input.int(70, title="RSI Overbought")
rsiOversold = input.int(30, title="RSI Oversold")
// 📊 ATR (Stop Loss e Take Profit)
atrLength = input.int(14, title="ATR Length", minval=1)
stopATR = input.float(1.5, title="Stop Loss (ATR Multiplo)", step=0.1)
takeProfitATR = input.float(2.0, title="Take Profit (ATR Multiplo)", step=0.1)
// 🔀 ADX
adxLength = input.int(14, title="ADX Length", minval=1)
adxSmoothing = input.int(14, title="ADX Smoothing", minval=1)
adxThreshold = input.int(20, title="Soglia ADX per Trend Forte", minval=1)
// === 📊 CALCOLI PRINCIPALI ===
// 📈 Medie Mobili
emaFast = ta.ema(close, emaFastLength)
emaSlow = ta.ema(close, emaSlowLength)
// 💡 RSI
rsi = ta.rsi(close, rsiLength)
// 📊 ATR
atr = ta.atr(atrLength)
// 🔀 ADX tramite DMI con Smoothing
[adx, diPlus, diMinus] = ta.dmi(adxLength, adxSmoothing)
// === 📊 CONDIZIONI LONG E SHORT ===
// ✅ Long: EMA Veloce incrocia EMA Lenta al rialzo, RSI sotto 70, ADX > 20
longCondition = (ta.crossover(emaFast, emaSlow)) and (rsi < rsiOverbought) and (adx > adxThreshold)
// 🔻 Short: EMA Veloce incrocia EMA Lenta al ribasso, RSI sopra 30, ADX > 20
shortCondition = (ta.crossunder(emaFast, emaSlow)) and (rsi > rsiOversold) and (adx > adxThreshold)
// 📉 Stop Loss e Take Profit Dinamici
longStop = strategy.position_avg_price - (atr * stopATR)
longTarget = strategy.position_avg_price + (atr * takeProfitATR)
shortStop = strategy.position_avg_price + (atr * stopATR)
shortTarget = strategy.position_avg_price - (atr * takeProfitATR)
// === 🚀 INGRESSO E USCITA ===
// 🚦 Ingresso LONG
if (longCondition and strategy.position_size == 0)
strategy.entry("Long", strategy.long)
strategy.exit("TakeProfit/StopLoss Long", stop=longStop, limit=longTarget)
// 🚦 Ingresso SHORT
if (shortCondition and strategy.position_size == 0)
strategy.entry("Short", strategy.short)
strategy.exit("TakeProfit/StopLoss Short", stop=shortStop, limit=shortTarget)
// 🛑 USCITA MANUALE BASATA SU RSI
if (rsi > rsiOverbought and strategy.position_size > 0)
strategy.close("Long", comment="RSI Overbought Exit")
if (rsi < rsiOversold and strategy.position_size < 0)
strategy.close("Short", comment="RSI Oversold Exit")
// === 📊 VISUALIZZAZIONE GRAFICA OTTIMIZZATA ===
// 📈 MEDIE MOBILI ANCORATE ALLE CANDELE
plot(emaFast, title="EMA Veloce", color=color.blue, linewidth=2)
plot(emaSlow, title="EMA Lenta", color=color.red, linewidth=2)
// 📊 SEGNALI VISIVI ANCORATI ALLE CANDELE
plotshape(longCondition, title="Segnale Long", style=shape.triangleup, location=location.belowbar, color=color.green, text="Long", size=size.small)
plotshape(shortCondition, title="Segnale Short", style=shape.triangledown, location=location.abovebar, color=color.red, text="Short", size=size.small)
// 📊 RSI (Pannello Separato)
var float rsiPanel = na
rsiPanel := rsi
plot(rsiPanel, title="RSI", color=color.orange, linewidth=2)
hline(rsiOverbought, "RSI Overbought", color=color.red, linestyle=hline.style_dotted)
hline(rsiOversold, "RSI Oversold", color=color.green, linestyle=hline.style_dotted)
// 📊 ADX (Pannello Separato)
var float adxPanel = na
adxPanel := adx
plot(adxPanel, title="ADX", color=color.blue, linewidth=2)
hline(adxThreshold, "ADX Soglia", color=color.gray, linestyle=hline.style_dotted)
// 📊 ATR (Pannello Separato)
var float atrPanel = na
atrPanel := atr
plot(atrPanel, title="ATR", color=color.purple, linewidth=2)
// 🔔 ALERT
alertcondition(longCondition, title="Segnale Long", message="Entra Long Manualmente!")
alertcondition(shortCondition, title="Segnale Short", message="Entra Short Manualmente!")