
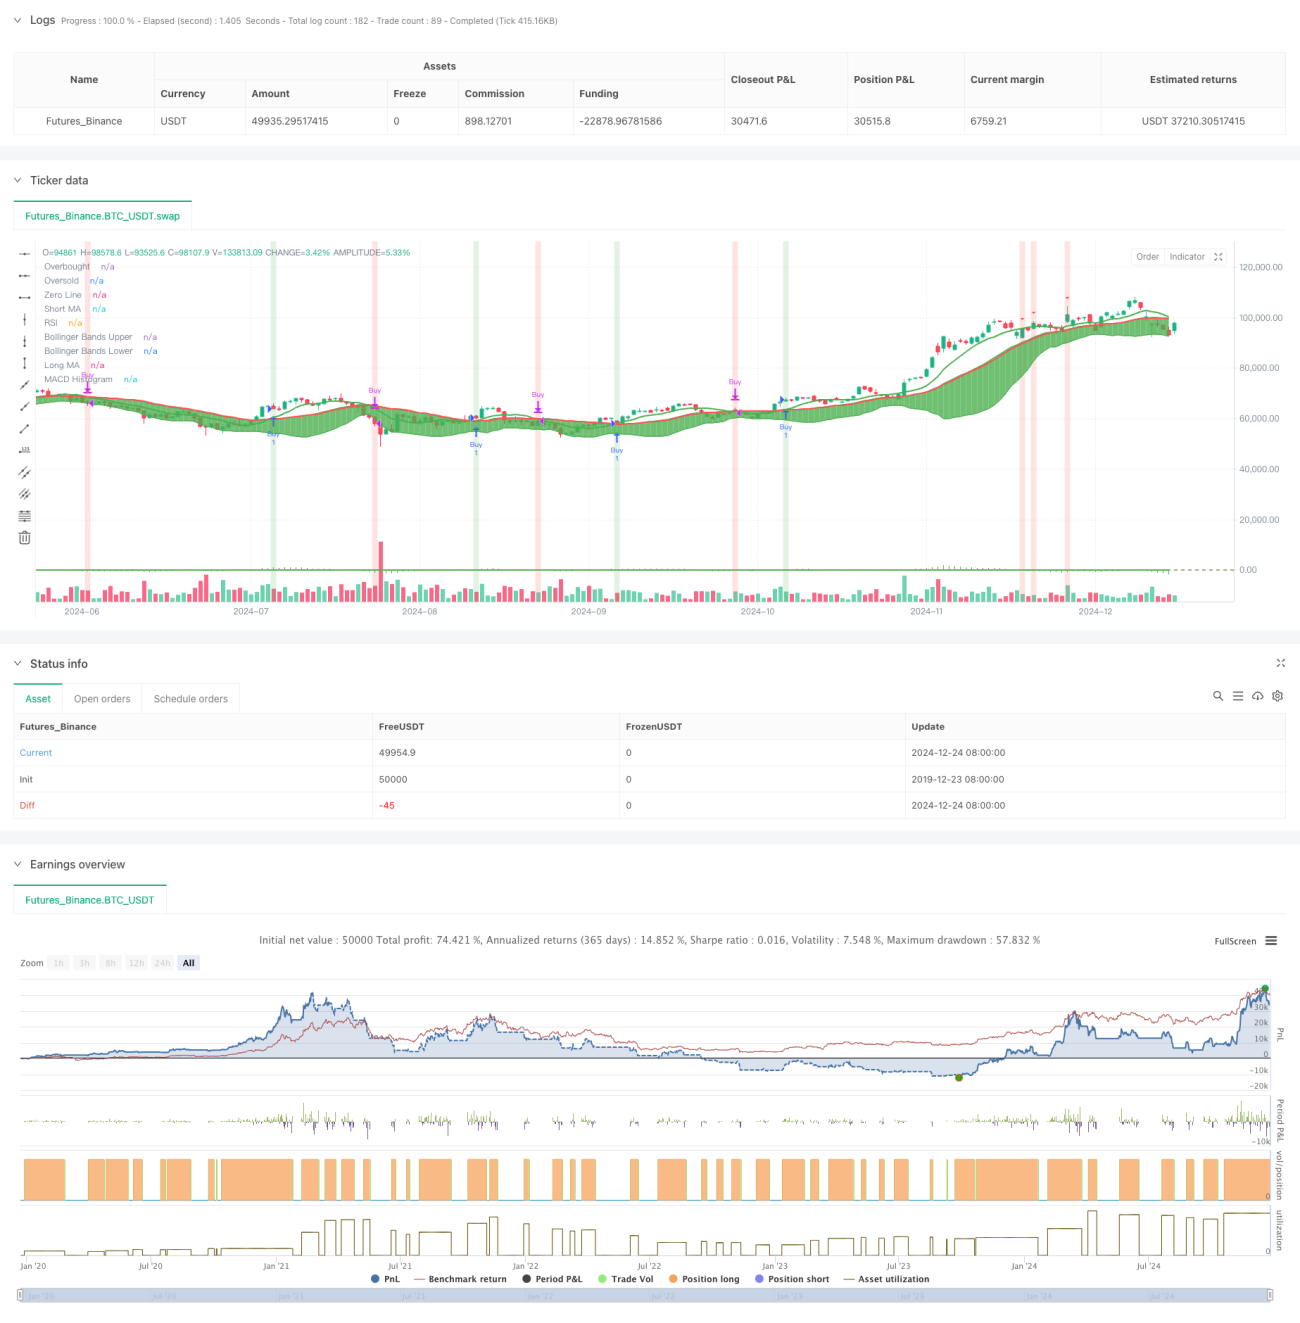
この戦略は、移動平均 (MA)、相対力指数 (RSI)、移動平均収束拡散 (MACD)、ボリンジャーバンド (BB) など、いくつかの古典的なテクニカル指標を組み合わせた包括的な取引システムです。システムはこれらの指標の協調的な連携を利用して、市場でより正確な売買シグナルを見つけ、それによって取引の成功率を向上させます。
この戦略では、主に以下の側面を含む多層信号検証メカニズムを採用しています。
システムは以下の条件下で取引シグナルを生成します。
これは、複数のテクニカル指標の相乗効果を通じて取引シグナルを提供する、適切に設計された多次元取引戦略システムです。この戦略の主な利点は、包括的な分析フレームワークと厳格なシグナル確認メカニズムにありますが、パラメータの最適化や市場環境への適応性などの問題にも注意を払う必要があります。推奨される最適化の方向性では、この戦略にはまだ改善の余地が大いにあります。
/*backtest
start: 2019-12-23 08:00:00
end: 2024-12-25 08:00:00
period: 1d
basePeriod: 1d
exchanges: [{"eid":"Futures_Binance","currency":"BTC_USDT"}]
*/
//@version=5
strategy("Ultimate Buy/Sell Indicator", overlay=true)
// Inputs for Moving Averages
shortMaLength = input.int(9, title="Short MA Length", minval=1)
longMaLength = input.int(21, title="Long MA Length", minval=1)
// Inputs for RSI
rsiLength = input.int(14, title="RSI Length", minval=1)
rsiOverbought = input.int(70, title="RSI Overbought Level", minval=1, maxval=100)
rsiOversold = input.int(30, title="RSI Oversold Level", minval=1, maxval=100)
// Inputs for MACD
macdShortLength = input.int(12, title="MACD Short EMA Length", minval=1)
macdLongLength = input.int(26, title="MACD Long EMA Length", minval=1)
macdSignalSmoothing = input.int(9, title="MACD Signal Smoothing", minval=1)
// Inputs for Bollinger Bands
bbLength = input.int(20, title="Bollinger Bands Length", minval=1)
bbMultiplier = input.float(2.0, title="Bollinger Bands Multiplier", minval=0.1)
// Calculate Moving Averages
shortMa = ta.sma(close, shortMaLength)
longMa = ta.sma(close, longMaLength)
// Calculate RSI
rsi = ta.rsi(close, rsiLength)
// Calculate MACD
[macdLine, signalLine, _] = ta.macd(close, macdShortLength, macdLongLength, macdSignalSmoothing)
macdHist = macdLine - signalLine
// Calculate Bollinger Bands
[bbUpper, bbBasis, bbLower] = ta.bb(close, bbLength, bbMultiplier)
// Define colors
colorPrimary = color.new(color.green, 0)
colorSecondary = color.new(color.red, 0)
colorBackgroundBuy = color.new(color.green, 80)
colorBackgroundSell = color.new(color.red, 80)
colorTextBuy = color.new(color.green, 0)
colorTextSell = color.new(color.red, 0)
// Plot Moving Averages
plot(shortMa, color=colorPrimary, linewidth=2, title="Short MA")
plot(longMa, color=colorSecondary, linewidth=2, title="Long MA")
// Plot Bollinger Bands
bbUpperLine = plot(bbUpper, color=colorPrimary, linewidth=1, title="Bollinger Bands Upper")
bbLowerLine = plot(bbLower, color=colorPrimary, linewidth=1, title="Bollinger Bands Lower")
fill(bbUpperLine, bbLowerLine, color=color.new(colorPrimary, 90))
// Buy/Sell Conditions based on MA cross
buySignal = ta.crossover(shortMa, longMa)
sellSignal = ta.crossunder(shortMa, longMa)
// Execute Buy/Sell Orders
if buySignal
strategy.entry("Buy", strategy.long, 1)
strategy.close("Sell", qty_percent=1) // Close all positions when selling
if sellSignal
strategy.close("Sell", qty_percent=1) // Close all positions when selling
strategy.close("Buy") // Close any remaining buy positions
// Plot Buy/Sell Signals for MA crossovers
plotshape(series=buySignal, location=location.belowbar, color=colorTextBuy, style=shape.triangleup, size=size.small, title="Buy Signal")
plotshape(series=sellSignal, location=location.abovebar, color=colorTextSell, style=shape.triangledown, size=size.small, title="Sell Signal")
// Background Color based on Buy/Sell Signal for MA crossovers
bgcolor(buySignal ? colorBackgroundBuy : na, title="Buy Signal Background")
bgcolor(sellSignal ? colorBackgroundSell : na, title="Sell Signal Background")
// Plot RSI with Overbought/Oversold Levels
hline(rsiOverbought, "Overbought", color=colorSecondary, linestyle=hline.style_dashed, linewidth=1)
hline(rsiOversold, "Oversold", color=colorPrimary, linestyle=hline.style_dashed, linewidth=1)
plot(rsi, color=colorPrimary, linewidth=2, title="RSI")
// Plot MACD Histogram
plot(macdHist, color=colorPrimary, style=plot.style_histogram, title="MACD Histogram", linewidth=2)
hline(0, "Zero Line", color=color.new(color.gray, 80))
// Additional Buy/Sell Conditions based on RSI, MACD, and Bollinger Bands
additionalBuySignal = rsi < rsiOversold and macdHist > 0 and close < bbLower
additionalSellSignal = rsi > rsiOverbought and macdHist < 0 and close > bbUpper
// Plot Additional Buy/Sell Signals
plotshape(series=additionalBuySignal and not buySignal, location=location.belowbar, color=colorTextBuy, style=shape.triangleup, size=size.small, title="Additional Buy Signal")
plotshape(series=additionalSellSignal and not sellSignal, location=location.abovebar, color=colorTextSell, style=shape.triangledown, size=size.small, title="Additional Sell Signal")
// Background Color based on Additional Buy/Sell Signal
bgcolor(additionalBuySignal and not buySignal ? colorBackgroundBuy : na, title="Additional Buy Signal Background")
bgcolor(additionalSellSignal and not sellSignal ? colorBackgroundSell : na, title="Additional Sell Signal Background")